PNC Bank 2012 Annual Report Download - page 200
Download and view the complete annual report
Please find page 200 of the 2012 PNC Bank annual report below. You can navigate through the pages in the report by either clicking on the pages listed below, or by using the keyword search tool below to find specific information within the annual report.-
 1
1 -
2
-
3
-
4
-
5
-
6
-
7
-
8
-
9
-
10
-
11
-
12
-
13
-
14
-
15
-
16
-
17
-
18
-
19
-
20
-
21
-
22
-
23
-
24
-
25
-
26
-
27
-
28
-
29
-
30
-
31
-
32
-
33
-
34
-
35
-
36
-
37
-
38
-
39
-
40
-
41
-
42
-
43
-
44
-
45
-
46
-
47
-
48
-
49
-
50
-
51
-
52
-
53
-
54
-
55
-
56
-
57
-
58
-
59
-
60
-
61
-
62
-
63
-
64
-
65
-
66
-
67
-
68
-
69
-
70
-
71
-
72
-
73
-
74
-
75
-
76
-
77
-
78
-
79
-
80
-
81
-
82
-
83
-
84
-
85
-
86
-
87
-
88
-
89
-
90
-
91
-
92
-
93
-
94
-
95
-
96
-
97
-
98
-
99
-
100
-
101
-
102
-
103
-
104
-
105
-
106
-
107
-
108
-
109
-
110
-
111
-
112
-
113
-
114
-
115
-
116
-
117
-
118
-
119
-
120
-
121
-
122
-
123
-
124
-
125
-
126
-
127
-
128
-
129
-
130
-
131
-
132
-
133
-
134
-
135
-
136
-
137
-
138
-
139
-
140
-
141
-
142
-
143
-
144
-
145
-
146
-
147
-
148
-
149
-
150
-
151
-
152
-
153
-
154
-
155
-
156
-
157
-
158
-
159
-
160
-
161
-
162
-
163
-
164
-
165
-
166
-
167
-
168
-
169
-
170
-
171
-
172
-
173
-
174
-
175
-
176
-
177
-
178
-
179
-
180
-
181
-
182
-
183
-
184
-
185
-
186
-
187
-
188
-
189
-
 190
190 -
 191
191 -
 192
192 -
 193
193 -
 194
194 -
 195
195 -
 196
196 -
 197
197 -
 198
198 -
 199
199 -
 200
200 -
 201
201 -
 202
202 -
 203
203 -
 204
204 -
 205
205 -
 206
206 -
 207
207 -
 208
208 -
 209
209 -
 210
210 -
211
-
212
-
213
-
214
-
215
-
216
-
217
-
218
-
219
-
220
-
221
-
222
-
223
-
224
-
225
-
226
-
227
-
228
-
229
-
230
-
231
-
232
-
233
-
234
-
235
-
236
-
237
-
238
-
239
-
240
-
241
-
242
-
243
-
244
-
245
-
246
-
247
-
248
-
249
-
250
-
251
-
252
-
253
-
254
-
255
-
256
-
257
-
258
-
259
-
260
-
261
-
262
-
263
-
264
-
265
-
266
-
267
-
268
-
269
-
270
-
271
-
272
-
273
-
274
-
275
-
276
-
277
-
278
-
279
-
280
 |
 |
O
THER
F
INANCIAL
A
SSETS
A
CCOUNTED FOR AT
F
AIR
V
ALUE
ON A
N
ONRECURRING
B
ASIS
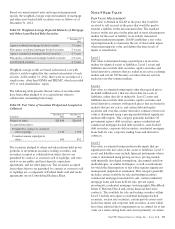
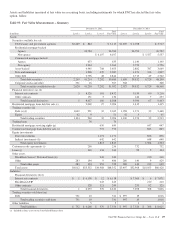
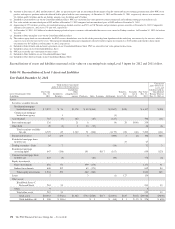
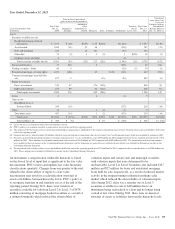
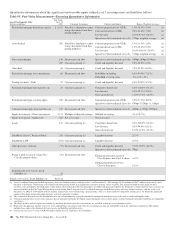
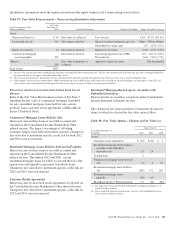
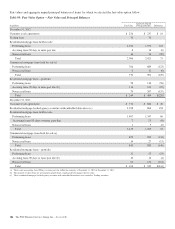
We may be required to measure certain other financial assets
at fair value on a nonrecurring basis. These adjustments to fair
value usually result from the application of lower-of-cost-or-
fair value accounting or write-downs of individual assets due
to impairment and are included in Table 96: Fair Value
Measurements – Nonrecurring and Table 97: Fair Value
Measurements – Nonrecurring Quantitative Information.
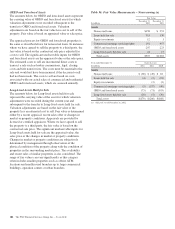
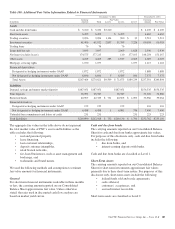
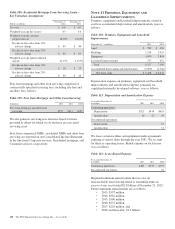
Nonaccrual Loans
The amounts below for nonaccrual loans represent the fair
value of those loans which have been adjusted due to
impairment. The impairment is primarily based on the
appraised value of the collateral or LGD percentage. The LGD
percentage is used to determine the weighted average loss
severity of the nonaccrual loans.
As part of the appraisal process, persons ordering or reviewing
appraisals are independent of the asset manager. Appraisals
must be provided by licensed or certified appraisers and
conform to the Uniform Standards of Professional Appraisal
Practice. For loans secured by commercial properties where
the underlying collateral is in excess of $250,000, appraisals
are obtained at least annually. In certain instances (e.g.,
physical changes in the property), a more recent appraisal is
obtained. Additionally, borrower ordered appraisals are not
permitted, and PNC ordered appraisals are regularly reviewed.
For loans secured by commercial properties where the
underlying collateral is $250,000 and less, there is no
requirement to obtain an appraisal. In instances where an
appraisal is not obtained, the collateral value is determined
consistent with external third-party appraisal standards by an
internal person independent of the asset manager. PNC has a
real estate valuation services group whose sole function is to
manage the real estate appraisal solicitation and evaluation
process for commercial loans. All third-party appraisals are
reviewed by this group, including consideration of comments/
questions on the appraisal by the reviewer, customer
relationship manager, credit officer, and underwriter. Upon
resolving these comments/questions through discussions with
the third-party appraiser, adjustments to the initial appraisal
may occur and be incorporated into the final issued appraisal
report.
If an appraisal is outdated due to changed project or market
conditions, or if the net book value is utilized, management
uses an LGD percentage which represents the exposure PNC
expects to lose in the event a borrower defaults on an
obligation. Accordingly, LGD, which represents the loss
severity, is a function of collateral recovery rates and loan-to-
value. Those rates are established based upon actual PNC loss
experience and external market data. In instances where we
have agreed to sell the property to a third party, the fair value
is based on the contractual sales price adjusted for costs to
sell. In these instances, the most significant unobservable
input is the appraised value or the sales price. The estimated
costs to sell are incremental direct costs to transact a sale such
as broker commissions, legal, closing costs and title transfer
fees. The costs must be essential to the sale and would not
have been incurred if the decision to sell had not been made.
The costs to sell are based on costs associated with our actual
sales of commercial and residential OREO and foreclosed
assets, which are assessed annually.
Loans Held for Sale
The amounts below for loans held for sale include the carrying
value of commercial mortgage loans which are intended to be
sold with servicing retained. The fair value of the commercial
mortgage loans is determined using discounted cash flows.
Significant observable market data includes the applicable
benchmark U.S. Treasury interest rates. These instruments are
classified within Level 3. Significant unobservable inputs
include a spread over the benchmark curve and the embedded
servicing value. Significant increases (decreases) to the spread
over the benchmark curve would result in a significantly lower
(higher) carrying value of the assets. Significant increases
(decreases) in the embedded servicing value would result in
significantly higher (lower) carrying value.
Loans held for sale also includes syndicated commercial loan
inventory. The fair value of the syndicated commercial loan
inventory is primarily determined based on prices provided by
a third-party vendor. The third-party vendor prices are based
upon dealer quotes. These instruments are classified within
Level 2. There were no loans held for sale categorized as
Level 2 at December 31, 2012.
Equity Investments
The amounts below for equity investments represent the
carrying value of Low Income Housing Tax Credit (LIHTC)
investments held for sale calculated using a discounted cash
flow model. The significant unobservable input is
management’s estimate of required market rate of return. The
market rate of return is based on comparison to recent LIHTC
sales in the market. Significant increases (decreases) in this
input would result in a significantly lower (higher) carrying
value of the investments.
Commercial Mortgage Servicing Rights
Commercial MSRs are periodically evaluated for impairment
and the amounts below reflect an impairment of two strata at
December 31, 2012 and three strata at December 31, 2011,
respectively. For purposes of impairment, the commercial
MSRs are stratified based on asset type, which characterizes
the predominant risk of the underlying financial asset. The fair
value of commercial MSRs is estimated by using a discounted
cash flow model incorporating unobservable inputs for
assumptions as to constant prepayment rates, discount rates
and other factors. Significant increases (decreases) in constant
prepayment rates and discount rates would result in
significantly lower (higher) commercial MSR value
determined based on current market conditions and
expectations.
The PNC Financial Services Group, Inc. – Form 10-K 181