PNC Bank 2012 Annual Report Download - page 170
Download and view the complete annual report
Please find page 170 of the 2012 PNC Bank annual report below. You can navigate through the pages in the report by either clicking on the pages listed below, or by using the keyword search tool below to find specific information within the annual report.-
 1
1 -
2
-
3
-
4
-
5
-
6
-
7
-
8
-
9
-
10
-
11
-
12
-
13
-
14
-
15
-
16
-
17
-
18
-
19
-
20
-
21
-
22
-
23
-
24
-
25
-
26
-
27
-
28
-
29
-
30
-
31
-
32
-
33
-
34
-
35
-
36
-
37
-
38
-
39
-
40
-
41
-
42
-
43
-
44
-
45
-
46
-
47
-
48
-
49
-
50
-
51
-
52
-
53
-
54
-
55
-
56
-
57
-
58
-
59
-
60
-
61
-
62
-
63
-
64
-
65
-
66
-
67
-
68
-
69
-
70
-
71
-
72
-
73
-
74
-
75
-
76
-
77
-
78
-
79
-
80
-
81
-
82
-
83
-
84
-
85
-
86
-
87
-
88
-
89
-
90
-
91
-
92
-
93
-
94
-
95
-
96
-
97
-
98
-
99
-
100
-
101
-
102
-
103
-
104
-
105
-
106
-
107
-
108
-
109
-
110
-
111
-
112
-
113
-
114
-
115
-
116
-
117
-
118
-
119
-
120
-
121
-
122
-
123
-
124
-
125
-
126
-
127
-
128
-
129
-
130
-
131
-
132
-
133
-
134
-
135
-
136
-
137
-
138
-
139
-
140
-
141
-
142
-
143
-
144
-
145
-
146
-
147
-
148
-
149
-
150
-
151
-
152
-
153
-
154
-
155
-
156
-
157
-
158
-
159
-
 160
160 -
 161
161 -
 162
162 -
 163
163 -
 164
164 -
 165
165 -
 166
166 -
 167
167 -
 168
168 -
 169
169 -
 170
170 -
 171
171 -
 172
172 -
 173
173 -
 174
174 -
 175
175 -
 176
176 -
 177
177 -
 178
178 -
 179
179 -
 180
180 -
181
-
182
-
183
-
184
-
185
-
186
-
187
-
188
-
189
-
190
-
191
-
192
-
193
-
194
-
195
-
196
-
197
-
198
-
199
-
200
-
201
-
202
-
203
-
204
-
205
-
206
-
207
-
208
-
209
-
210
-
211
-
212
-
213
-
214
-
215
-
216
-
217
-
218
-
219
-
220
-
221
-
222
-
223
-
224
-
225
-
226
-
227
-
228
-
229
-
230
-
231
-
232
-
233
-
234
-
235
-
236
-
237
-
238
-
239
-
240
-
241
-
242
-
243
-
244
-
245
-
246
-
247
-
248
-
249
-
250
-
251
-
252
-
253
-
254
-
255
-
256
-
257
-
258
-
259
-
260
-
261
-
262
-
263
-
264
-
265
-
266
-
267
-
268
-
269
-
270
-
271
-
272
-
273
-
274
-
275
-
276
-
277
-
278
-
279
-
280
 |
 |
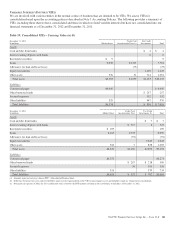
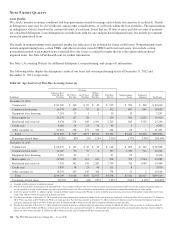
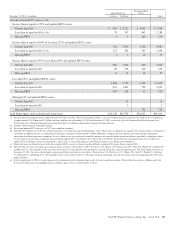
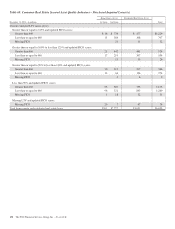
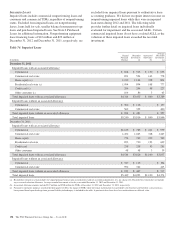
Home Equity (g)
Residential Real
Estate
December 31, 2011 - in millions 1st Liens 2nd Liens Total
Current estimated LTV ratios (c) (d)
Greater than or equal to 125% and updated FICO scores:
Greater than 660 $ 481 $ 3,222 $ 1,845 $ 5,548
Less than or equal to 660 (e) (f) 78 747 463 1,288
Missing FICO 1 9 289 299
Greater than or equal to 100% to less than 125% and updated FICO scores:
Greater than 660 706 2,940 1,336 4,982
Less than or equal to 660 (e) (f) 127 582 349 1,058
Missing FICO 1 5 53 59
Greater than or equal to 90% to less than 100% and updated FICO scores:
Greater than 660 660 1,587 760 3,007
Less than or equal to 660 98 255 200 553
Missing FICO 815 12 35
Less than 90% and updated FICO scores:
Greater than 660 6,588 9,747 3,152 19,487
Less than or equal to 660 821 1,405 799 3,025
Missing FICO 679 218 32 929
Missing LTV and updated FICO scores:
Greater than 660 11 11
Less than or equal to 660 22
Missing FICO 731 731
Total home equity and residential real estate loans $10,248 $20,745 $10,021 $41,014
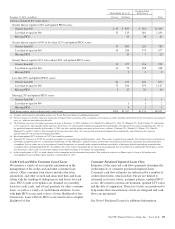
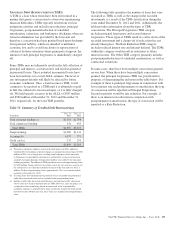
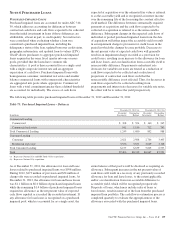
(a) Excludes purchased impaired loans of approximately $6.6 billion and $6.5 billion in outstanding balances, certain government insured or guaranteed residential real estate mortgages
of approximately $2.2 billion and $2.9 billion, and loans held for sale at December 31, 2012 and December 31, 2011, respectively. See the Consumer Real Estate Secured Asset
Quality Indicators—Purchased Impaired Loans table that follows for additional information on purchased impaired loans.
(b) Amounts shown represent outstanding balance.
(c) Based upon updated LTV (inclusive of CLTV for second lien positions).
(d) Updated LTV (inclusive of CLTV for second lien positions) are estimated using modeled property values. These ratios are updated semi-annually. The related estimates and inputs are
based upon an approach that uses a combination of third-party automated valuation models (AVMs), HPI indices, property location, internal and external balance information,
origination data and management assumptions. In cases where we are in an originated second lien position, we generally utilize origination balances provided by a third-party which
do not include an amortization assumption when calculating updated LTV. Accordingly, the results of these calculations do not represent actual appraised loan level collateral or
updated LTV based upon a current first lien balance, and as such, are necessarily imprecise and subject to change as we enhance our methodology.
(e) Higher risk loans are defined as loans with both an updated FICO score of less than or equal to 660 and an updated LTV greater than or equal to 100%.
(f) The following states have the highest percentage of higher risk loans at December 31, 2012: New Jersey 14%, Illinois 12%, Pennsylvania 10%, Ohio 10%, Florida 9%, California 9%,
and Maryland 5%. The remainder of the states have lower than 5% of the high risk loans individually, and collectively they represent approximately 31% of the higher risk loans. At
December 31, 2011, the states with the highest percentage of higher risk loans were as follows: Pennsylvania 13%, New Jersey 13%, Illinois 10%, Ohio 9%, Florida 8%, California
8%, Maryland 5%, and Michigan 5%. The remainder of the states had lower than 3% of the high risk loans individually, and collectively they represented approximately 29% of the
higher risk loans.
(g) In the second quarter of 2012, we made changes to the assumptions used to determine home equity first and second lien positions. This resulted in an increase in Home equity 2nd
liens of $2.4 billion and a corresponding decrease in Home equity 1st liens as of December 31, 2011.
The PNC Financial Services Group, Inc. – Form 10-K 151