PNC Bank 2012 Annual Report Download - page 187
Download and view the complete annual report
Please find page 187 of the 2012 PNC Bank annual report below. You can navigate through the pages in the report by either clicking on the pages listed below, or by using the keyword search tool below to find specific information within the annual report.-
 1
1 -
2
-
3
-
4
-
5
-
6
-
7
-
8
-
9
-
10
-
11
-
12
-
13
-
14
-
15
-
16
-
17
-
18
-
19
-
20
-
21
-
22
-
23
-
24
-
25
-
26
-
27
-
28
-
29
-
30
-
31
-
32
-
33
-
34
-
35
-
36
-
37
-
38
-
39
-
40
-
41
-
42
-
43
-
44
-
45
-
46
-
47
-
48
-
49
-
50
-
51
-
52
-
53
-
54
-
55
-
56
-
57
-
58
-
59
-
60
-
61
-
62
-
63
-
64
-
65
-
66
-
67
-
68
-
69
-
70
-
71
-
72
-
73
-
74
-
75
-
76
-
77
-
78
-
79
-
80
-
81
-
82
-
83
-
84
-
85
-
86
-
87
-
88
-
89
-
90
-
91
-
92
-
93
-
94
-
95
-
96
-
97
-
98
-
99
-
100
-
101
-
102
-
103
-
104
-
105
-
106
-
107
-
108
-
109
-
110
-
111
-
112
-
113
-
114
-
115
-
116
-
117
-
118
-
119
-
120
-
121
-
122
-
123
-
124
-
125
-
126
-
127
-
128
-
129
-
130
-
131
-
132
-
133
-
134
-
135
-
136
-
137
-
138
-
139
-
140
-
141
-
142
-
143
-
144
-
145
-
146
-
147
-
148
-
149
-
150
-
151
-
152
-
153
-
154
-
155
-
156
-
157
-
158
-
159
-
160
-
161
-
162
-
163
-
164
-
165
-
166
-
167
-
168
-
169
-
170
-
171
-
172
-
173
-
174
-
175
-
176
-
 177
177 -
 178
178 -
 179
179 -
 180
180 -
 181
181 -
 182
182 -
 183
183 -
 184
184 -
 185
185 -
 186
186 -
 187
187 -
 188
188 -
 189
189 -
 190
190 -
 191
191 -
 192
192 -
 193
193 -
 194
194 -
 195
195 -
 196
196 -
 197
197 -
198
-
199
-
200
-
201
-
202
-
203
-
204
-
205
-
206
-
207
-
208
-
209
-
210
-
211
-
212
-
213
-
214
-
215
-
216
-
217
-
218
-
219
-
220
-
221
-
222
-
223
-
224
-
225
-
226
-
227
-
228
-
229
-
230
-
231
-
232
-
233
-
234
-
235
-
236
-
237
-
238
-
239
-
240
-
241
-
242
-
243
-
244
-
245
-
246
-
247
-
248
-
249
-
250
-
251
-
252
-
253
-
254
-
255
-
256
-
257
-
258
-
259
-
260
-
261
-
262
-
263
-
264
-
265
-
266
-
267
-
268
-
269
-
270
-
271
-
272
-
273
-
274
-
275
-
276
-
277
-
278
-
279
-
280
 |
 |

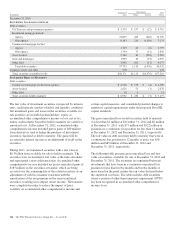
The security-level assessment is performed on each security,
regardless of the classification of the security as available for
sale or held to maturity. Our assessment considers the security
structure, recent security collateral performance metrics if
applicable, external credit ratings, failure of the issuer to make
scheduled interest or principal payments, our judgment and
expectations of future performance, and relevant independent
industry research, analysis and forecasts. Results of the
periodic assessment are reviewed by a cross-functional senior
management team representing Asset & Liability
Management, Finance, and Market Risk Management. The
senior management team considers the results of the
assessments, as well as other factors, in determining whether
the impairment is other-than-temporary.
For debt securities, a critical component of the evaluation for
OTTI is the identification of credit-impaired securities, where
management does not expect to receive cash flows sufficient
to recover the entire amortized cost basis of the security. The
paragraphs below describe our process for identifying credit
impairment for our most significant categories of securities
not backed by the US government or its agencies.
Non-Agency Residential Mortgage-Backed Securities and
Asset-Backed Securities Collateralized by First-Lien and
Second-Lien Non-Agency Residential Mortgage Loans
Potential credit losses on these securities are evaluated on a
security by security basis. Collateral performance assumptions
are developed for each security after reviewing collateral
composition and collateral performance statistics. This
includes analyzing recent delinquency roll rates, loss
severities, voluntary prepayments, and various other collateral
and performance metrics. This information is then combined
with general expectations on the housing market, employment,
and other economic factors to develop estimates of future
performance.
Security level assumptions for prepayments, loan defaults, and
loss given default are applied to every security using a third-
party cash flow model. The third-party cash flow model then
generates projected cash flows according to the structure of
each security. Based on the results of the cash flow analysis,
we determine whether we will recover the amortized cost
basis of our security.
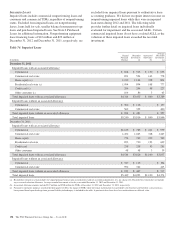
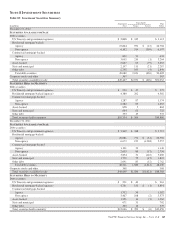
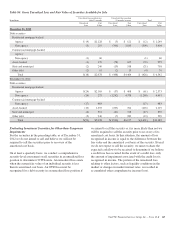
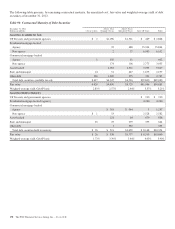
The following table provides detail on the significant
assumptions used to determine credit impairment for non-
agency residential mortgage-backed and asset-backed
securities collateralized by first-lien and second-lien non-
agency residential mortgage loans.
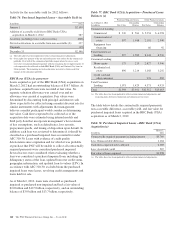
Table 85: Credit Impairment Assessment Assumptions—
Non-Agency Residential Mortgage-Backed and Asset-
Backed Securities (a)
December 31, 2012 Range
Weighted-
average (b)
Long-term prepayment rate (annual CPR)
Prime 7 - 20% 14%
Alt-A 5 - 12 6
Option ARM 3 - 6 3
Remaining collateral expected to default
Prime 0 - 51% 19%
Alt-A 2 - 61 33
Option ARM 19 - 73 52
Loss severity
Prime 25 - 72% 46%
Alt-A 30 - 85 60
Option ARM 40 - 70 60
(a) Collateralized by first and second-lien non-agency residential mortgage loans.
(b) Calculated by weighting the relevant assumption for each individual security by the
current outstanding cost basis of the security.
Non-Agency Commercial Mortgage-Backed Securities
Credit losses on these securities are measured using property-
level cash flow projections and forward-looking property
valuations. Cash flows are projected using a detailed analysis of
net operating income (NOI) by property type which, in turn, is
based on the analysis of NOI performance over the past several
business cycles combined with PNC’s economic outlook for the
current cycle. Loss severities are based on property price
projections, which are calculated using capitalization rate
projections. The capitalization rate projections are based on a
combination of historical capitalization rates and expected
capitalization rates implied by current market activity, our
outlook and relevant independent industry research, analysis and
forecasts. Securities exhibiting weaker performance within the
model are subject to further analysis. This analysis is performed
at the loan level, and includes assessing local market conditions,
reserves, occupancy, rent rolls and master/special servicer details.
168 The PNC Financial Services Group, Inc. – Form 10-K