PNC Bank 2012 Annual Report Download - page 143
Download and view the complete annual report
Please find page 143 of the 2012 PNC Bank annual report below. You can navigate through the pages in the report by either clicking on the pages listed below, or by using the keyword search tool below to find specific information within the annual report.-
 1
1 -
2
-
3
-
4
-
5
-
6
-
7
-
8
-
9
-
10
-
11
-
12
-
13
-
14
-
15
-
16
-
17
-
18
-
19
-
20
-
21
-
22
-
23
-
24
-
25
-
26
-
27
-
28
-
29
-
30
-
31
-
32
-
33
-
34
-
35
-
36
-
37
-
38
-
39
-
40
-
41
-
42
-
43
-
44
-
45
-
46
-
47
-
48
-
49
-
50
-
51
-
52
-
53
-
54
-
55
-
56
-
57
-
58
-
59
-
60
-
61
-
62
-
63
-
64
-
65
-
66
-
67
-
68
-
69
-
70
-
71
-
72
-
73
-
74
-
75
-
76
-
77
-
78
-
79
-
80
-
81
-
82
-
83
-
84
-
85
-
86
-
87
-
88
-
89
-
90
-
91
-
92
-
93
-
94
-
95
-
96
-
97
-
98
-
99
-
100
-
101
-
102
-
103
-
104
-
105
-
106
-
107
-
108
-
109
-
110
-
111
-
112
-
113
-
114
-
115
-
116
-
117
-
118
-
119
-
120
-
121
-
122
-
123
-
124
-
125
-
126
-
127
-
128
-
129
-
130
-
131
-
132
-
 133
133 -
 134
134 -
 135
135 -
 136
136 -
 137
137 -
 138
138 -
 139
139 -
 140
140 -
 141
141 -
 142
142 -
 143
143 -
 144
144 -
 145
145 -
 146
146 -
 147
147 -
 148
148 -
 149
149 -
 150
150 -
 151
151 -
 152
152 -
 153
153 -
154
-
155
-
156
-
157
-
158
-
159
-
160
-
161
-
162
-
163
-
164
-
165
-
166
-
167
-
168
-
169
-
170
-
171
-
172
-
173
-
174
-
175
-
176
-
177
-
178
-
179
-
180
-
181
-
182
-
183
-
184
-
185
-
186
-
187
-
188
-
189
-
190
-
191
-
192
-
193
-
194
-
195
-
196
-
197
-
198
-
199
-
200
-
201
-
202
-
203
-
204
-
205
-
206
-
207
-
208
-
209
-
210
-
211
-
212
-
213
-
214
-
215
-
216
-
217
-
218
-
219
-
220
-
221
-
222
-
223
-
224
-
225
-
226
-
227
-
228
-
229
-
230
-
231
-
232
-
233
-
234
-
235
-
236
-
237
-
238
-
239
-
240
-
241
-
242
-
243
-
244
-
245
-
246
-
247
-
248
-
249
-
250
-
251
-
252
-
253
-
254
-
255
-
256
-
257
-
258
-
259
-
260
-
261
-
262
-
263
-
264
-
265
-
266
-
267
-
268
-
269
-
270
-
271
-
272
-
273
-
274
-
275
-
276
-
277
-
278
-
279
-
280
 |
 |

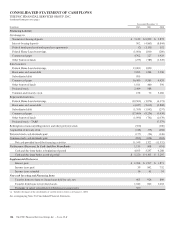
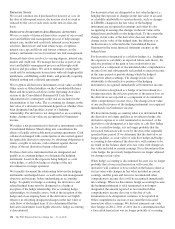
CONSOLIDATED STATEMENT OF CASH FLOWS
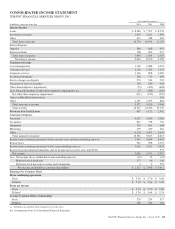
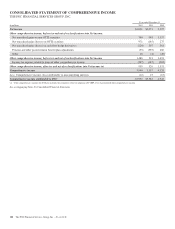
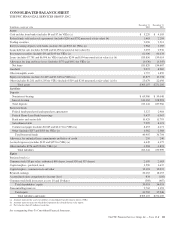
THE PNC FINANCIAL SERVICES GROUP, INC.
(continued from previous page)
Year ended December 31
In millions 2012 2011 2010
Financing Activities
Net change in
Noninterest-bearing deposits $ 7,149 $ 8,909 $ 5,872
Interest-bearing deposits 902 (4,863) (8,844)
Federal funds purchased and repurchase agreements (2) (1,151) 152
Federal Home Loan borrowings (1,000) 1,000 (280)
Commercial paper 4,762 227 1,929
Other borrowed funds (279) (789) (1,549)
Sales/issuances
Federal Home Loan borrowings 13,000 1,000
Bank notes and senior debt 2,093 1,244 3,230
Subordinated debt 995
Commercial paper 16,480 9,565 4,424
Other borrowed funds 1,011 460 396
Preferred stock 2,449 988
Common and treasury stock 158 72 3,486
Repayments/maturities
Federal Home Loan borrowings (10,500) (1,076) (4,373)
Bank notes and senior debt (4,037) (2,612) (2,808)
Subordinated debt (1,769) (1,942) (257)
Commercial paper (17,060) (8,236) (3,638)
Other borrowed funds (1,090) (741) (1,039)
Preferred stock – TARP (7,579)
Redemption of noncontrolling interest and other preferred stock (500) (100)
Acquisition of treasury stock (216) (73) (204)
Preferred stock cash dividends paid (177) (56) (146)
Common stock cash dividends paid (820) (604) (204)
Net cash provided (used) by financing activities 11,549 1,322 (11,532)
Net Increase (Decrease) In Cash And Due From Banks 1,115 808 (991)
Cash and due from banks at beginning of period 4,105 3,297 4,288
Cash and due from banks at end of period $ 5,220 $ 4,105 $ 3,297
Supplemental Disclosures
Interest paid $ 1,208 $ 1,517 $ 1,871
Income taxes paid 39 842 752
Income taxes refunded 16 41 54
Non-cash Investing and Financing Items
Transfer from (to) loans to (from) loans held for sale, net 665 926 890
Transfer from loans to foreclosed assets 1,042 822 1,218
Exchange of junior subordinated debentures for senior notes 500
(a) Includes the impact of the consolidation of variable interest entities as of January 1, 2010.
See accompanying Notes To Consolidated Financial Statements.
124 The PNC Financial Services Group, Inc. – Form 10-K