PNC Bank 2012 Annual Report Download - page 114
Download and view the complete annual report
Please find page 114 of the 2012 PNC Bank annual report below. You can navigate through the pages in the report by either clicking on the pages listed below, or by using the keyword search tool below to find specific information within the annual report.-
 1
1 -
2
-
3
-
4
-
5
-
6
-
7
-
8
-
9
-
10
-
11
-
12
-
13
-
14
-
15
-
16
-
17
-
18
-
19
-
20
-
21
-
22
-
23
-
24
-
25
-
26
-
27
-
28
-
29
-
30
-
31
-
32
-
33
-
34
-
35
-
36
-
37
-
38
-
39
-
40
-
41
-
42
-
43
-
44
-
45
-
46
-
47
-
48
-
49
-
50
-
51
-
52
-
53
-
54
-
55
-
56
-
57
-
58
-
59
-
60
-
61
-
62
-
63
-
64
-
65
-
66
-
67
-
68
-
69
-
70
-
71
-
72
-
73
-
74
-
75
-
76
-
77
-
78
-
79
-
80
-
81
-
82
-
83
-
84
-
85
-
86
-
87
-
88
-
89
-
90
-
91
-
92
-
93
-
94
-
95
-
96
-
97
-
98
-
99
-
100
-
101
-
102
-
103
-
 104
104 -
 105
105 -
 106
106 -
 107
107 -
 108
108 -
 109
109 -
 110
110 -
 111
111 -
 112
112 -
 113
113 -
 114
114 -
 115
115 -
 116
116 -
 117
117 -
 118
118 -
 119
119 -
 120
120 -
 121
121 -
 122
122 -
 123
123 -
 124
124 -
125
-
126
-
127
-
128
-
129
-
130
-
131
-
132
-
133
-
134
-
135
-
136
-
137
-
138
-
139
-
140
-
141
-
142
-
143
-
144
-
145
-
146
-
147
-
148
-
149
-
150
-
151
-
152
-
153
-
154
-
155
-
156
-
157
-
158
-
159
-
160
-
161
-
162
-
163
-
164
-
165
-
166
-
167
-
168
-
169
-
170
-
171
-
172
-
173
-
174
-
175
-
176
-
177
-
178
-
179
-
180
-
181
-
182
-
183
-
184
-
185
-
186
-
187
-
188
-
189
-
190
-
191
-
192
-
193
-
194
-
195
-
196
-
197
-
198
-
199
-
200
-
201
-
202
-
203
-
204
-
205
-
206
-
207
-
208
-
209
-
210
-
211
-
212
-
213
-
214
-
215
-
216
-
217
-
218
-
219
-
220
-
221
-
222
-
223
-
224
-
225
-
226
-
227
-
228
-
229
-
230
-
231
-
232
-
233
-
234
-
235
-
236
-
237
-
238
-
239
-
240
-
241
-
242
-
243
-
244
-
245
-
246
-
247
-
248
-
249
-
250
-
251
-
252
-
253
-
254
-
255
-
256
-
257
-
258
-
259
-
260
-
261
-
262
-
263
-
264
-
265
-
266
-
267
-
268
-
269
-
270
-
271
-
272
-
273
-
274
-
275
-
276
-
277
-
278
-
279
-
280
 |
 |

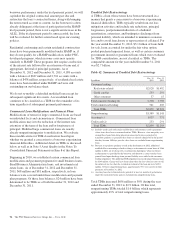
TDRs that have returned to performing (accruing) status are
excluded from nonperforming loans. These loans have
demonstrated a period of at least six months of consecutive
performance under the restructured terms. These TDRs
increased $.3 billion, or 35% during 2012 to $1.0 billion as of
December 31, 2012. This increase reflects the further
seasoning and performance of the TDRs. See Note 5 Asset
Quality in the Notes to Consolidated Financial Statements in
Item 8 of this Report for additional information.
A
LLOWANCES
F
OR
L
OAN
A
ND
L
EASE
L
OSSES
A
ND
U
NFUNDED
L
OAN
C
OMMITMENTS
A
ND
L
ETTERS
O
F
C
REDIT
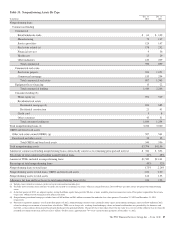
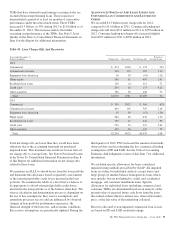
We recorded $1.3 billion in net charge-offs for 2012,
compared to $1.6 billion in 2011. Commercial lending net
charge-offs fell from $712 million in 2011 to $359 million in
2012. Consumer lending net charge-offs increased slightly
from $927 million in 2011 to $930 million in 2012.
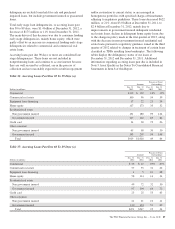
Table 43: Loan Charge-Offs And Recoveries
Year ended December 31
Dollars in millions Charge-offs Recoveries Net Charge-offs
Percent of
Average Loans
2012
Commercial $ 474 $300 $ 174 .23%
Commercial real estate 314 115 199 1.10
Equipment lease financing 16 30 (14) (.21)
Home equity 560 61 499 1.41
Residential real estate 110 (1) 111 .72
Credit card 200 26 174 4.26
Other consumer 196 50 146 .72
Total $1,870 $581 $1,289 .73
2011
Commercial $ 700 $332 $ 368 .62%
Commercial real estate 464 105 359 2.14
Equipment lease financing 35 50 (15) (.24)
Home equity 484 48 436 1.30
Residential real estate 153 11 142 .95
Credit card 235 23 212 5.62
Other consumer 193 56 137 .79
Total $2,264 $625 $1,639 1.08
Total net charge-offs are lower than they would have been
otherwise due to the accounting treatment for purchased
impaired loans. This treatment also results in a lower ratio of
net charge-offs to average loans. See Note 6 Purchased Loans
in the Notes To Consolidated Financial Statements in Item 8
of this Report for additional information on net charge-offs
related to these loans.
We maintain an ALLL to absorb losses from the loan portfolio
and determine this allowance based on quarterly assessments
of the estimated probable credit losses incurred in the loan
portfolio. We maintain the ALLL at a level that we believe to
be appropriate to absorb estimated probable credit losses
incurred in the loan portfolio as of the balance sheet date. The
reserve calculation and determination process is dependent on
the use of key assumptions. Key reserve assumptions and
estimation processes react to and are influenced by observed
changes in loan portfolio performance experience, the
financial strength of the borrower, and economic conditions.
Key reserve assumptions are periodically updated. During the
third quarter of 2012, PNC increased the amount of internally
observed data used in estimating the key commercial lending
assumptions of PD and LGD. See the Critical Accounting
Estimates And Judgments section of this Item 7 for additional
information.
We establish specific allowances for loans considered
impaired using methods prescribed by GAAP. All impaired
loans are subject to individual analysis, except leases and
large groups of smaller-balance homogeneous loans which
may include, but are not limited to, credit card, residential
mortgage, and consumer installment loans. Specific
allowances for individual loans (including commercial and
consumer TDRs) are determined based on an analysis of the
present value of expected future cash flows from the loans
discounted at their effective interest rate, observable market
price, or the fair value of the underlying collateral.
Reserves allocated to non-impaired commercial loan classes
are based on PD and LGD credit risk ratings.
The PNC Financial Services Group, Inc. – Form 10-K 95