PNC Bank 2012 Annual Report Download - page 105
Download and view the complete annual report
Please find page 105 of the 2012 PNC Bank annual report below. You can navigate through the pages in the report by either clicking on the pages listed below, or by using the keyword search tool below to find specific information within the annual report.-
 1
1 -
2
-
3
-
4
-
5
-
6
-
7
-
8
-
9
-
10
-
11
-
12
-
13
-
14
-
15
-
16
-
17
-
18
-
19
-
20
-
21
-
22
-
23
-
24
-
25
-
26
-
27
-
28
-
29
-
30
-
31
-
32
-
33
-
34
-
35
-
36
-
37
-
38
-
39
-
40
-
41
-
42
-
43
-
44
-
45
-
46
-
47
-
48
-
49
-
50
-
51
-
52
-
53
-
54
-
55
-
56
-
57
-
58
-
59
-
60
-
61
-
62
-
63
-
64
-
65
-
66
-
67
-
68
-
69
-
70
-
71
-
72
-
73
-
74
-
75
-
76
-
77
-
78
-
79
-
80
-
81
-
82
-
83
-
84
-
85
-
86
-
87
-
88
-
89
-
90
-
91
-
92
-
93
-
94
-
 95
95 -
 96
96 -
 97
97 -
 98
98 -
 99
99 -
 100
100 -
 101
101 -
 102
102 -
 103
103 -
 104
104 -
 105
105 -
 106
106 -
 107
107 -
 108
108 -
 109
109 -
 110
110 -
 111
111 -
 112
112 -
 113
113 -
 114
114 -
 115
115 -
116
-
117
-
118
-
119
-
120
-
121
-
122
-
123
-
124
-
125
-
126
-
127
-
128
-
129
-
130
-
131
-
132
-
133
-
134
-
135
-
136
-
137
-
138
-
139
-
140
-
141
-
142
-
143
-
144
-
145
-
146
-
147
-
148
-
149
-
150
-
151
-
152
-
153
-
154
-
155
-
156
-
157
-
158
-
159
-
160
-
161
-
162
-
163
-
164
-
165
-
166
-
167
-
168
-
169
-
170
-
171
-
172
-
173
-
174
-
175
-
176
-
177
-
178
-
179
-
180
-
181
-
182
-
183
-
184
-
185
-
186
-
187
-
188
-
189
-
190
-
191
-
192
-
193
-
194
-
195
-
196
-
197
-
198
-
199
-
200
-
201
-
202
-
203
-
204
-
205
-
206
-
207
-
208
-
209
-
210
-
211
-
212
-
213
-
214
-
215
-
216
-
217
-
218
-
219
-
220
-
221
-
222
-
223
-
224
-
225
-
226
-
227
-
228
-
229
-
230
-
231
-
232
-
233
-
234
-
235
-
236
-
237
-
238
-
239
-
240
-
241
-
242
-
243
-
244
-
245
-
246
-
247
-
248
-
249
-
250
-
251
-
252
-
253
-
254
-
255
-
256
-
257
-
258
-
259
-
260
-
261
-
262
-
263
-
264
-
265
-
266
-
267
-
268
-
269
-
270
-
271
-
272
-
273
-
274
-
275
-
276
-
277
-
278
-
279
-
280
 |
 |
N
ONPERFORMING
A
SSETS AND
L
OAN
D
ELINQUENCIES
Nonperforming Assets, including OREO and Foreclosed
Assets
Nonperforming assets include nonaccrual loans and leases for
which ultimate collectability of the full amount of contractual
principal and interest is not probable and include
nonperforming TDRs, OREO and foreclosed assets. Loans
held for sale, certain government insured or guaranteed loans,
purchased impaired loans and loans accounted for under the
fair value option are excluded from nonperforming loans.
Additional information regarding our nonaccrual policies is
included in Note 1 Accounting Policies in the Notes To
Consolidated Financial Statements in Item 8 of this Report.
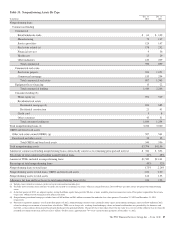
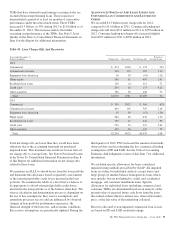
The major categories of nonperforming assets are presented in
the table below.
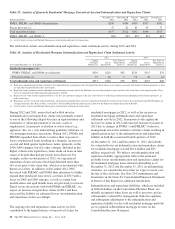
Nonperforming assets decreased $362 million from
December 31, 2011, to $3.8 billion at December 31, 2012, as
discussed above. Nonperforming loans decreased $306 million
to $3.3 billion and OREO and foreclosed assets decreased $56
million to $540 million. The ratio of nonperforming assets to
total loans, OREO and foreclosed assets decreased to 2.04% at
December 31, 2012 from 2.60% at December 31, 2011. The
ratio of nonperforming loans to total loans declined to 1.75%
at December 31, 2012, compared to 2.24% at December 31,
2011. Total nonperforming assets have declined $2.6 billion,
or 41%, from their peak of $6.4 billion at March 31, 2010.
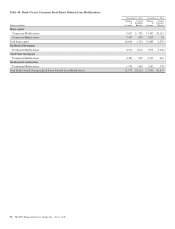
Management continues to evaluate nonaccrual and charge-off
policies for second-lien consumer loans (residential mortgages
and home equity loans and lines) pursuant to interagency
supervisory guidance on practices for loans and lines of credit
secured by junior liens on 1-4 family residential properties.
This will result in future classification of performing second-
lien consumer loans as nonperforming where the first-lien
loan is 90 days or more past due. Pursuant to the guidance, the
Company will adopt a policy in the first quarter of 2013,
subsequent to operationalizing related procedures, to charge-
off a portion of certain second-lien consumer loans
(residential mortgage and home equity lines of credit) where
the first-lien loan is 90 days or more past due. Additionally,
given these operational enhancements and pursuant to
interagency supervisory guidance, the company will update
certain additional nonaccrual and charge-off policies. We
estimate adding approximately $350 million to $450 million
to the nonaccrual consumer loan population in the first quarter
of 2013. If these policies had been in effect as of
December 31, 2012, there would have been an estimated
cumulative charge-off of approximately $140 million. The
credit loss policies for these loans are considered in our
reserving process and the risk of loss associated with these
loans was considered in the determination of our ALLL at
December 31, 2012.
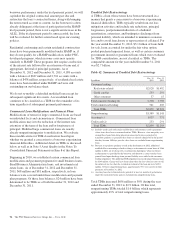
At December 31, 2012, TDRs included in nonperforming
loans were $1.6 billion or 49% of total nonperforming loans
compared to $1.1 billion or 32% of nonperforming loans as of
December 31, 2011. Within consumer nonperforming loans,
residential real estate TDRs comprise 64% of total residential
real estate nonperforming loans at December 31, 2012, up
from 51% at December 31, 2011. Home equity TDRs
comprise 70% of home equity nonperforming loans at
December 31, 2012, down from 77% at December 31, 2011.
The level of TDRs in these portfolios is expected to result in
elevated nonperforming loan levels because TDRs remain in
nonperforming status until a borrower has made at least six
consecutive months of payments under the modified terms or
ultimate resolution occurs.
At December 31, 2012, our largest nonperforming asset was
$38 million and in the Real Estate Rental and Leasing
Industry. Our average nonperforming loans associated with
commercial lending were under $1 million. Eight of our ten
largest outstanding nonperforming assets are from the
commercial lending portfolio and represent 11% and 4% of
total commercial lending nonperforming loans and total
nonperforming assets, respectively, as of December 31, 2012.
86 The PNC Financial Services Group, Inc. – Form 10-K