PNC Bank 2012 Annual Report Download - page 235
Download and view the complete annual report
Please find page 235 of the 2012 PNC Bank annual report below. You can navigate through the pages in the report by either clicking on the pages listed below, or by using the keyword search tool below to find specific information within the annual report.-
 1
1 -
2
-
3
-
4
-
5
-
6
-
7
-
8
-
9
-
10
-
11
-
12
-
13
-
14
-
15
-
16
-
17
-
18
-
19
-
20
-
21
-
22
-
23
-
24
-
25
-
26
-
27
-
28
-
29
-
30
-
31
-
32
-
33
-
34
-
35
-
36
-
37
-
38
-
39
-
40
-
41
-
42
-
43
-
44
-
45
-
46
-
47
-
48
-
49
-
50
-
51
-
52
-
53
-
54
-
55
-
56
-
57
-
58
-
59
-
60
-
61
-
62
-
63
-
64
-
65
-
66
-
67
-
68
-
69
-
70
-
71
-
72
-
73
-
74
-
75
-
76
-
77
-
78
-
79
-
80
-
81
-
82
-
83
-
84
-
85
-
86
-
87
-
88
-
89
-
90
-
91
-
92
-
93
-
94
-
95
-
96
-
97
-
98
-
99
-
100
-
101
-
102
-
103
-
104
-
105
-
106
-
107
-
108
-
109
-
110
-
111
-
112
-
113
-
114
-
115
-
116
-
117
-
118
-
119
-
120
-
121
-
122
-
123
-
124
-
125
-
126
-
127
-
128
-
129
-
130
-
131
-
132
-
133
-
134
-
135
-
136
-
137
-
138
-
139
-
140
-
141
-
142
-
143
-
144
-
145
-
146
-
147
-
148
-
149
-
150
-
151
-
152
-
153
-
154
-
155
-
156
-
157
-
158
-
159
-
160
-
161
-
162
-
163
-
164
-
165
-
166
-
167
-
168
-
169
-
170
-
171
-
172
-
173
-
174
-
175
-
176
-
177
-
178
-
179
-
180
-
181
-
182
-
183
-
184
-
185
-
186
-
187
-
188
-
189
-
190
-
191
-
192
-
193
-
194
-
195
-
196
-
197
-
198
-
199
-
200
-
201
-
202
-
203
-
204
-
205
-
206
-
207
-
208
-
209
-
210
-
211
-
212
-
213
-
214
-
215
-
216
-
217
-
218
-
219
-
220
-
221
-
222
-
223
-
224
-
 225
225 -
 226
226 -
 227
227 -
 228
228 -
 229
229 -
 230
230 -
 231
231 -
 232
232 -
 233
233 -
 234
234 -
 235
235 -
 236
236 -
 237
237 -
 238
238 -
 239
239 -
 240
240 -
 241
241 -
 242
242 -
 243
243 -
 244
244 -
 245
245 -
246
-
247
-
248
-
249
-
250
-
251
-
252
-
253
-
254
-
255
-
256
-
257
-
258
-
259
-
260
-
261
-
262
-
263
-
264
-
265
-
266
-
267
-
268
-
269
-
270
-
271
-
272
-
273
-
274
-
275
-
276
-
277
-
278
-
279
-
280
 |
 |

N
OTE
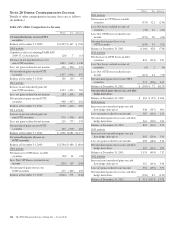
20 O
THER
C
OMPREHENSIVE
I
NCOME
Details of other comprehensive income (loss) are as follows
(in millions):
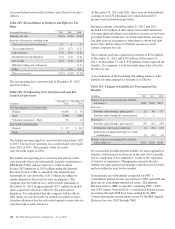
Table 145: Other Comprehensive Income
Pretax Tax After-tax
Net unrealized gains on non-OTTI
securities
Balance at December 31, 2009 $(1,207) $ 447 $ (760)
2010 activity
Cumulative effect of adopting FASB ASU
2009-17, Consolidations (20) 7 (13)
Decrease in net unrealized losses for
non-OTTI securities 1,803 (665) 1,138
Less: net gains realized in net income 426 (156) 270
Net unrealized gains on non-OTTI
securities 1,357 (502) 855
Balance at December 31, 2010 150 (55) 95
2011 activity
Increase in net unrealized gains for
non-OTTI securities 1,232 (451) 781
Less: net gains realized in net income 284 (104) 180
Net unrealized gains on non-OTTI
securities 948 (347) 601
Balance at December 31, 2011 1,098 (402) 696
2012 activity
Increase in net unrealized gains for
non-OTTI securities 970 (356) 614
Less: net gains realized in net income 210 (77) 133
Net unrealized gains on non-OTTI
securities 760 (279) 481
Balance at December 31, 2012 $ 1,858 $(681) $1,177
Net unrealized gains (losses) on
OTTI securities
Balance at December 31, 2009 $(1,296) $ 480 $ (816)
2010 activity
Net increase in OTTI losses on debt
securities (50) 14 (36)
Less: Net OTTI losses realized in net
income (325) 119 (206)
Net unrealized gains (losses) on
OTTI securities 275 (105) 170
Balance at December 31, 2010 (1,021) 375 (646)
Pretax Tax After-tax
2011 activity
Net increase in OTTI losses on debt
securities (331) 121 (210)
Less: Net losses realized on sales of
securities (34) 12 (22)
Less: Net OTTI losses realized in net
income (152) 56 (96)
Net unrealized gains (losses) on
OTTI securities (145) 53 (92)
Balance at December 31, 2011 (1,166) 428 (738)
2012 activity
Net decrease in OTTI losses on debt
securities 854 (313) 541
Less: Net losses realized on sales of
securities (6) 2 (4)
Less: Net OTTI losses realized in net
income (111) 41 (70)
Net unrealized gains (losses) on OTTI
securities 971 (356) 615
Balance at December 31, 2012 $ (195) $ 72 $(123)
Net unrealized gains (losses) on cash flow
hedge derivatives
Balance at December 31, 2009 $ 263 $ (97) $ 166
2010 activity
Increase in net unrealized gains on cash
flow hedge derivatives 948 (347) 601
Less: net gains realized in net income 387 (142) 245
Net unrealized gains (losses) on cash flow
hedge derivatives 561 (205) 356
Balance at December 31, 2010 824 (302) 522
2011 activity
Increase in net unrealized gains on cash
flow hedge derivatives 805 (294) 511
Less: net gains realized in net income 498 (182) 316
Net unrealized gains (losses) on cash flow
hedge derivatives 307 (112) 195
Balance at December 31, 2011 1,131 (414) 717
2012 activity
Increase in net unrealized gains on cash
flow hedge derivatives 312 (114) 198
Less: net gains realized in net income 532 (195) 337
Net unrealized gains (losses) on cash flow
hedge derivatives (220) 81 (139)
Balance at December 31, 2012 $ 911 $(333) $ 578
216 The PNC Financial Services Group, Inc. – Form 10-K