PNC Bank 2012 Annual Report Download - page 57
Download and view the complete annual report
Please find page 57 of the 2012 PNC Bank annual report below. You can navigate through the pages in the report by either clicking on the pages listed below, or by using the keyword search tool below to find specific information within the annual report.-
 1
1 -
2
-
3
-
4
-
5
-
6
-
7
-
8
-
9
-
10
-
11
-
12
-
13
-
14
-
15
-
16
-
17
-
18
-
19
-
20
-
21
-
22
-
23
-
24
-
25
-
26
-
27
-
28
-
29
-
30
-
31
-
32
-
33
-
34
-
35
-
36
-
37
-
38
-
39
-
40
-
41
-
42
-
43
-
44
-
45
-
46
-
 47
47 -
 48
48 -
 49
49 -
 50
50 -
 51
51 -
 52
52 -
 53
53 -
 54
54 -
 55
55 -
 56
56 -
 57
57 -
 58
58 -
 59
59 -
 60
60 -
 61
61 -
 62
62 -
 63
63 -
 64
64 -
 65
65 -
 66
66 -
 67
67 -
68
-
69
-
70
-
71
-
72
-
73
-
74
-
75
-
76
-
77
-
78
-
79
-
80
-
81
-
82
-
83
-
84
-
85
-
86
-
87
-
88
-
89
-
90
-
91
-
92
-
93
-
94
-
95
-
96
-
97
-
98
-
99
-
100
-
101
-
102
-
103
-
104
-
105
-
106
-
107
-
108
-
109
-
110
-
111
-
112
-
113
-
114
-
115
-
116
-
117
-
118
-
119
-
120
-
121
-
122
-
123
-
124
-
125
-
126
-
127
-
128
-
129
-
130
-
131
-
132
-
133
-
134
-
135
-
136
-
137
-
138
-
139
-
140
-
141
-
142
-
143
-
144
-
145
-
146
-
147
-
148
-
149
-
150
-
151
-
152
-
153
-
154
-
155
-
156
-
157
-
158
-
159
-
160
-
161
-
162
-
163
-
164
-
165
-
166
-
167
-
168
-
169
-
170
-
171
-
172
-
173
-
174
-
175
-
176
-
177
-
178
-
179
-
180
-
181
-
182
-
183
-
184
-
185
-
186
-
187
-
188
-
189
-
190
-
191
-
192
-
193
-
194
-
195
-
196
-
197
-
198
-
199
-
200
-
201
-
202
-
203
-
204
-
205
-
206
-
207
-
208
-
209
-
210
-
211
-
212
-
213
-
214
-
215
-
216
-
217
-
218
-
219
-
220
-
221
-
222
-
223
-
224
-
225
-
226
-
227
-
228
-
229
-
230
-
231
-
232
-
233
-
234
-
235
-
236
-
237
-
238
-
239
-
240
-
241
-
242
-
243
-
244
-
245
-
246
-
247
-
248
-
249
-
250
-
251
-
252
-
253
-
254
-
255
-
256
-
257
-
258
-
259
-
260
-
261
-
262
-
263
-
264
-
265
-
266
-
267
-
268
-
269
-
270
-
271
-
272
-
273
-
274
-
275
-
276
-
277
-
278
-
279
-
280
 |
 |

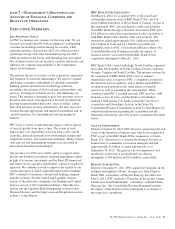
We refer you to Item 1 of this Report under the captions
Business Overview and Review of Business Segments for an
overview of our business segments and to the Business
Segments Review section of this Item 7 for the Results Of
Businesses – Summary table and further analysis of business
segment results for 2012 and 2011, including presentation
differences from Note 26 Segment Reporting in the Notes To
Consolidated Financial Statements in Item 8 of this Report.
We provide a reconciliation of total business segment earnings
to PNC consolidated income from continuing operations
before noncontrolling interests as reported according to
accounting principles generally accepted in the United States
of America (GAAP) in Note 26 Segment Reporting in our
Notes To Consolidated Financial Statements of Item 8 of this
Report.
R
ETAIL
B
ANKING
Retail Banking earned $596 million in 2012 compared with
$371 million in 2011. The increase in earnings resulted from
organic growth in transaction deposit balances, gains on sales
of Visa Class B common shares, lower rates paid on deposits,
higher levels of customer-initiated transactions, a lower
provision for credit losses, and the impact of the RBC Bank
(USA) acquisition, partially offset by the regulatory impact of
lower interchange fees on debit card transactions and higher
additions to legal reserves.
C
ORPORATE
&I
NSTITUTIONAL
B
ANKING
Corporate & Institutional Banking earned $2.3 billion in 2012
compared with $1.9 billion in 2011. The increase in earnings
was primarily due to higher revenue partially offset by higher
noninterest expense and a provision for credit losses of zero in
2012 compared with a benefit of $124 million in 2011. We
continued to focus on building client relationships including
increasing cross sales and adding new clients where the risk-
return profile was attractive.
A
SSET
M
ANAGEMENT
G
ROUP
Asset Management Group earned $145 million in 2012
compared with $168 million in 2011. Assets under
administration increased to $224 billion at December 31, 2012
from $210 billion at December 31, 2011 driven by stronger
average equity markets. Revenue increased $44 million in the
year over year comparison as strong sales and higher average
equity markets increased noninterest income by 4% and
higher average deposit balances increased net interest income
by 6%. The revenue increase was offset by higher noninterest
expense from strategic business investments and higher
provision for credit losses.
R
ESIDENTIAL
M
ORTGAGE
B
ANKING
Residential Mortgage Banking reported a loss of $308 million
in 2012 compared with earnings of $89 million in 2011.
Earnings declined from the prior year primarily as a result of
higher provision for residential mortgage repurchase
obligations, higher noninterest expense, including goodwill
impairment, and lower net hedging gains on mortgage
servicing rights, partially offset by increased loan sales
revenue driven by higher loan origination volume.
B
LACK
R
OCK
Our BlackRock business segment earned $395 million in 2012
and $361 million in 2011. We hold an equity investment in
BlackRock, which is a key component of our diversified
revenue strategy. BlackRock is a publicly traded company,
and additional information regarding its business is available
in its filings with the SEC.
N
ON
-S
TRATEGIC
A
SSETS
P
ORTFOLIO
This business segment consists primarily of non-strategic
assets obtained through acquisitions of other companies. Non-
Strategic Assets Portfolio had earnings of $237 million for
2012 compared with $200 million in 2011. The increase was
primarily attributable to a lower provision for credit losses,
partially offset by lower net interest income driven by declines
in loan balances and purchase accounting accretion.
O
THER
“Other” had a loss of $392 million in 2012 compared with a
loss of $58 million in 2011. The increase in loss in the 2012
period was primarily due to higher integration costs and
noncash charges related to redemption of trust preferred
securities.
38 The PNC Financial Services Group, Inc. – Form 10-K