PNC Bank 2012 Annual Report Download - page 198
Download and view the complete annual report
Please find page 198 of the 2012 PNC Bank annual report below. You can navigate through the pages in the report by either clicking on the pages listed below, or by using the keyword search tool below to find specific information within the annual report.-
 1
1 -
2
-
3
-
4
-
5
-
6
-
7
-
8
-
9
-
10
-
11
-
12
-
13
-
14
-
15
-
16
-
17
-
18
-
19
-
20
-
21
-
22
-
23
-
24
-
25
-
26
-
27
-
28
-
29
-
30
-
31
-
32
-
33
-
34
-
35
-
36
-
37
-
38
-
39
-
40
-
41
-
42
-
43
-
44
-
45
-
46
-
47
-
48
-
49
-
50
-
51
-
52
-
53
-
54
-
55
-
56
-
57
-
58
-
59
-
60
-
61
-
62
-
63
-
64
-
65
-
66
-
67
-
68
-
69
-
70
-
71
-
72
-
73
-
74
-
75
-
76
-
77
-
78
-
79
-
80
-
81
-
82
-
83
-
84
-
85
-
86
-
87
-
88
-
89
-
90
-
91
-
92
-
93
-
94
-
95
-
96
-
97
-
98
-
99
-
100
-
101
-
102
-
103
-
104
-
105
-
106
-
107
-
108
-
109
-
110
-
111
-
112
-
113
-
114
-
115
-
116
-
117
-
118
-
119
-
120
-
121
-
122
-
123
-
124
-
125
-
126
-
127
-
128
-
129
-
130
-
131
-
132
-
133
-
134
-
135
-
136
-
137
-
138
-
139
-
140
-
141
-
142
-
143
-
144
-
145
-
146
-
147
-
148
-
149
-
150
-
151
-
152
-
153
-
154
-
155
-
156
-
157
-
158
-
159
-
160
-
161
-
162
-
163
-
164
-
165
-
166
-
167
-
168
-
169
-
170
-
171
-
172
-
173
-
174
-
175
-
176
-
177
-
178
-
179
-
180
-
181
-
182
-
183
-
184
-
185
-
186
-
187
-
 188
188 -
 189
189 -
 190
190 -
 191
191 -
 192
192 -
 193
193 -
 194
194 -
 195
195 -
 196
196 -
 197
197 -
 198
198 -
 199
199 -
 200
200 -
 201
201 -
 202
202 -
 203
203 -
 204
204 -
 205
205 -
 206
206 -
 207
207 -
 208
208 -
209
-
210
-
211
-
212
-
213
-
214
-
215
-
216
-
217
-
218
-
219
-
220
-
221
-
222
-
223
-
224
-
225
-
226
-
227
-
228
-
229
-
230
-
231
-
232
-
233
-
234
-
235
-
236
-
237
-
238
-
239
-
240
-
241
-
242
-
243
-
244
-
245
-
246
-
247
-
248
-
249
-
250
-
251
-
252
-
253
-
254
-
255
-
256
-
257
-
258
-
259
-
260
-
261
-
262
-
263
-
264
-
265
-
266
-
267
-
268
-
269
-
270
-
271
-
272
-
273
-
274
-
275
-
276
-
277
-
278
-
279
-
280
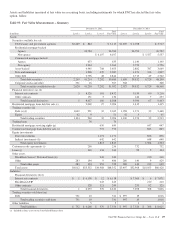
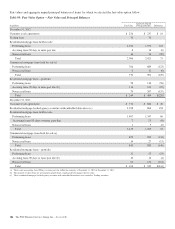
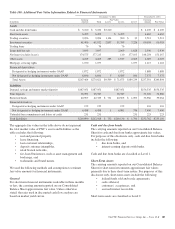
 |
 |
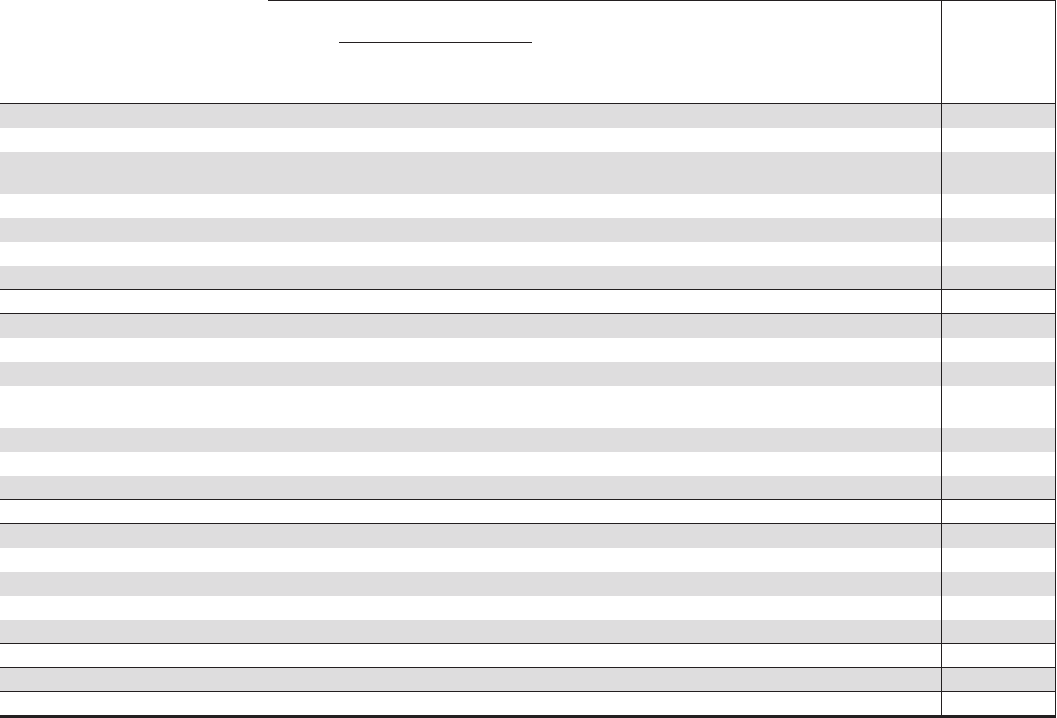
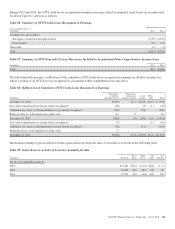
Year Ended December 31, 2011
Total realized / unrealized
gains or losses for the period (a)
Unrealized
gains (losses) on
assets and
liabilities held on
Consolidated
Balance Sheet at
Dec. 31, 2011 (c)
Level 3 Instruments Only
In millions
Fair Value
Dec. 31,
2010
Included in
Earnings
Included in
Other
comprehensive
income Purchases Sales Issuances Settlements
Transfers
out of
Level 3 (b)
Fair Value
Dec. 31,
2011
Assets
Securities available for sale
Residential mortgage-backed
non-agency $ 7,233 $ (80) $(157) $ 45 $(280) $(1,204) $ 5,557 $(130)
Asset-backed 1,045 (11) 21 48 (316) 787 (21)
State and municipal 228 10 121 (23) 336
Other debt 73 (2) 3 3 (3) 1 $(26) 49 (1)
Corporate stocks and other 4 (4)
Total securities available for sale 8,583 (93) (123) 217 (283) (1,546) (26) 6,729 (152)
Financial derivatives 77 263 5 (278) 67 188
Trading securities – Debt 69 4 (29) (5) 39 (5)
Residential mortgage servicing rights 1,033 (406) 65 $118 (163) 647 (383)
Commercial mortgage loans held for
sale 877 3 (13) (24) 843 (4)
Equity investments
Direct investments 749 87 176 (156) 856 58
Indirect investments 635 89 66 (142) 648 91
Total equity investments 1,384 176 242 (298) 1,504 149
Loans 2 4 (1) 5
Other assets
BlackRock Series C
Preferred Stock 396 (14) (172) 210 (14)
Other 11 1 (2) (1) 9
Total other assets 407 (14) 1 (2) (173) 219 (14)
Total assets $12,432 $ (67)(e) $(123) $534 $(596) $118 $(2,214) $(31) $10,053 $(221)(f)
Total liabilities (d) $ 460 $ 7(e) $ 10 $ (169) $ 308 $ (17)(f)
(a) Losses for assets are bracketed while losses for liabilities are not.
(b) PNC’s policy is to recognize transfers in and transfers out as of the end of the reporting period.
(c) The amount of the total gains or losses for the period included in earnings that is attributable to the change in unrealized gains or losses related to those assets and liabilities held at the
end of the reporting period.
(d) Financial derivatives, which includes $43 million related to swaps entered into in connection with sales of certain Visa Class B common shares which were included in earnings in 2012.
(e) Net gains (realized and unrealized) included in earnings relating to Level 3 assets and liabilities were $458 million for 2012 compared with net losses (realized and unrealized) of $74
million for 2011. These amounts also included amortization and accretion of $189 million for 2012 compared with $109 million for 2011. The amortization and accretion amounts
were included in Interest income on the Consolidated Income Statement, and the remaining net gains/(losses) (realized and unrealized) were included in Noninterest income on the
Consolidated Income Statement.
(f) Net unrealized gains relating to those assets and liabilities held at the end of the reporting period were $254 million for 2012, compared with net unrealized losses of $204 million for
2011. These amounts were included in Noninterest income on the Consolidated Income Statement.
An instrument’s categorization within the hierarchy is based
on the lowest level of input that is significant to the fair value
measurement. PNC reviews and updates fair value hierarchy
classifications quarterly. Changes from one quarter to the next
related to the observability of inputs to a fair value
measurement may result in a reclassification (transfer) of
assets or liabilities between hierarchy levels. PNC’s policy is
to recognize transfers in and transfers out as of the end of the
reporting period. During 2012, there were transfers of
securities available for sale from Level 2 to Level 3 of $478
million consisting of mortgage-backed securities as a result of
a ratings downgrade which reduced the observability of
valuation inputs and certain state and municipal securities
with valuation inputs that were determined to be
unobservable. Level 2 to Level 3 transfers also included $127
million and $27 million for loans and residential mortgage
loans held for sale, respectively, as a result of reduced market
activity in the nonperforming residential mortgage sales
market which reduced the observability of valuation inputs.
Also during 2012, there was a transfer out of Level 3
securities available for sale of $40 million due to an
instrument being reclassified to a loan and no longer being
carried at fair value. During 2011, there were no material
transfers of assets or liabilities between the hierarchy levels.
The PNC Financial Services Group, Inc. – Form 10-K 179