PNC Bank 2012 Annual Report Download - page 217
Download and view the complete annual report
Please find page 217 of the 2012 PNC Bank annual report below. You can navigate through the pages in the report by either clicking on the pages listed below, or by using the keyword search tool below to find specific information within the annual report.-
 1
1 -
2
-
3
-
4
-
5
-
6
-
7
-
8
-
9
-
10
-
11
-
12
-
13
-
14
-
15
-
16
-
17
-
18
-
19
-
20
-
21
-
22
-
23
-
24
-
25
-
26
-
27
-
28
-
29
-
30
-
31
-
32
-
33
-
34
-
35
-
36
-
37
-
38
-
39
-
40
-
41
-
42
-
43
-
44
-
45
-
46
-
47
-
48
-
49
-
50
-
51
-
52
-
53
-
54
-
55
-
56
-
57
-
58
-
59
-
60
-
61
-
62
-
63
-
64
-
65
-
66
-
67
-
68
-
69
-
70
-
71
-
72
-
73
-
74
-
75
-
76
-
77
-
78
-
79
-
80
-
81
-
82
-
83
-
84
-
85
-
86
-
87
-
88
-
89
-
90
-
91
-
92
-
93
-
94
-
95
-
96
-
97
-
98
-
99
-
100
-
101
-
102
-
103
-
104
-
105
-
106
-
107
-
108
-
109
-
110
-
111
-
112
-
113
-
114
-
115
-
116
-
117
-
118
-
119
-
120
-
121
-
122
-
123
-
124
-
125
-
126
-
127
-
128
-
129
-
130
-
131
-
132
-
133
-
134
-
135
-
136
-
137
-
138
-
139
-
140
-
141
-
142
-
143
-
144
-
145
-
146
-
147
-
148
-
149
-
150
-
151
-
152
-
153
-
154
-
155
-
156
-
157
-
158
-
159
-
160
-
161
-
162
-
163
-
164
-
165
-
166
-
167
-
168
-
169
-
170
-
171
-
172
-
173
-
174
-
175
-
176
-
177
-
178
-
179
-
180
-
181
-
182
-
183
-
184
-
185
-
186
-
187
-
188
-
189
-
190
-
191
-
192
-
193
-
194
-
195
-
196
-
197
-
198
-
199
-
200
-
201
-
202
-
203
-
204
-
205
-
206
-
 207
207 -
 208
208 -
 209
209 -
 210
210 -
 211
211 -
 212
212 -
 213
213 -
 214
214 -
 215
215 -
 216
216 -
 217
217 -
 218
218 -
 219
219 -
 220
220 -
 221
221 -
 222
222 -
 223
223 -
 224
224 -
 225
225 -
 226
226 -
 227
227 -
228
-
229
-
230
-
231
-
232
-
233
-
234
-
235
-
236
-
237
-
238
-
239
-
240
-
241
-
242
-
243
-
244
-
245
-
246
-
247
-
248
-
249
-
250
-
251
-
252
-
253
-
254
-
255
-
256
-
257
-
258
-
259
-
260
-
261
-
262
-
263
-
264
-
265
-
266
-
267
-
268
-
269
-
270
-
271
-
272
-
273
-
274
-
275
-
276
-
277
-
278
-
279
-
280
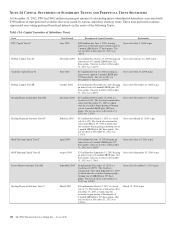
 |
 |

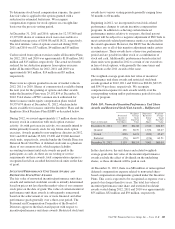
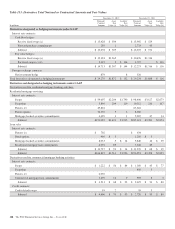
• Limited partnerships are valued by investment
managers based on recent financial information used
to estimate fair value. Other investments held by the
pension plan include derivative financial instruments
and real estate, which are recorded at estimated fair
value as determined by third-party appraisals and
pricing models, and group annuity contracts, which
are measured at fair value by discounting the related
cash flows based on current yields of similar
instruments with comparable durations considering
the credit-worthiness of the issuer.
These methods may result in fair value calculations that may
not be indicative of net realizable values or future fair values.
Furthermore, while the pension plan believes its valuation
methods are appropriate and consistent with other market
participants, the use of different methodologies or
assumptions to determine the fair value of certain financial
instruments could result in a different fair value measurement
at the reporting date.
The following table sets forth by level, within the fair value hierarchy, the Plan’s assets at fair value as of December 31, 2012 and
2011.
Table 120: Pension Plan Assets – Fair Value Hierarchy
Fair Value Measurements Using:
In millions
December 31
2012
Fair Value
Quoted Prices in
Active Markets
For Identical
Assets
(Level 1)
Significant
Other
Observable
Inputs
(Level 2)
Significant
Unobservable
Inputs
(Level 3)
Cash $1 $1
Money market funds 92 90 $ 2
US government and agency securities 449 184 265
Corporate debt (a) 875 853 $ 22
Common stock 984 982 2
Preferred stock 15 15
Mutual funds 20 4 16
Interest in Collective Funds (b) 1,415 1,327 88
Limited partnerships 128 1 127
Other 30 2 28
Total $4,009 $1,264 $2,508 $237
Fair Value Measurements Using:
In millions
December 31
2011
Fair Value
Quoted Prices in
Active Markets
For Identical
Assets
(Level 1)
Significant
Other
Observable
Inputs
(Level 2)
Significant
Unobservable
Inputs
(Level 3)
Cash $2 $2
Money market funds 137 135 $ 2
US government and agency securities 395 114 281
Corporate debt (a) 799 722 $ 77
Common stock 933 933
Preferred Stock 13 9 2 2
Mutual funds 37 37
Interest in Collective Funds (b) 1,314 937 377
Limited partnerships 130 130
Other 45 2 16 27
Total $3,805 $1,195 $1,997 $613
(a) Corporate debt includes $115 million and $106 million of non-agency mortgage-backed securities as of December 31, 2012 and 2011, respectively.
(b) The benefit plans own commingled funds that invest in equity and fixed income securities. The commingled funds that invest in equity securities seek to mirror the performance of the
S&P 500 Index, Russell 3000 Index, Morgan Stanley Capital International ACWI X US Index, and the Dow Jones U.S. Select Real Estate Securities Index. The commingled fund that
holds fixed income securities invests in domestic investment grade securities and seeks to mimic the performance of the Barclays Aggregate Bond Index.
198 The PNC Financial Services Group, Inc. – Form 10-K