PNC Bank 2012 Annual Report Download - page 127
Download and view the complete annual report
Please find page 127 of the 2012 PNC Bank annual report below. You can navigate through the pages in the report by either clicking on the pages listed below, or by using the keyword search tool below to find specific information within the annual report.-
 1
1 -
2
-
3
-
4
-
5
-
6
-
7
-
8
-
9
-
10
-
11
-
12
-
13
-
14
-
15
-
16
-
17
-
18
-
19
-
20
-
21
-
22
-
23
-
24
-
25
-
26
-
27
-
28
-
29
-
30
-
31
-
32
-
33
-
34
-
35
-
36
-
37
-
38
-
39
-
40
-
41
-
42
-
43
-
44
-
45
-
46
-
47
-
48
-
49
-
50
-
51
-
52
-
53
-
54
-
55
-
56
-
57
-
58
-
59
-
60
-
61
-
62
-
63
-
64
-
65
-
66
-
67
-
68
-
69
-
70
-
71
-
72
-
73
-
74
-
75
-
76
-
77
-
78
-
79
-
80
-
81
-
82
-
83
-
84
-
85
-
86
-
87
-
88
-
89
-
90
-
91
-
92
-
93
-
94
-
95
-
96
-
97
-
98
-
99
-
100
-
101
-
102
-
103
-
104
-
105
-
106
-
107
-
108
-
109
-
110
-
111
-
112
-
113
-
114
-
115
-
116
-
 117
117 -
 118
118 -
 119
119 -
 120
120 -
 121
121 -
 122
122 -
 123
123 -
 124
124 -
 125
125 -
 126
126 -
 127
127 -
 128
128 -
 129
129 -
 130
130 -
 131
131 -
 132
132 -
 133
133 -
 134
134 -
 135
135 -
 136
136 -
 137
137 -
138
-
139
-
140
-
141
-
142
-
143
-
144
-
145
-
146
-
147
-
148
-
149
-
150
-
151
-
152
-
153
-
154
-
155
-
156
-
157
-
158
-
159
-
160
-
161
-
162
-
163
-
164
-
165
-
166
-
167
-
168
-
169
-
170
-
171
-
172
-
173
-
174
-
175
-
176
-
177
-
178
-
179
-
180
-
181
-
182
-
183
-
184
-
185
-
186
-
187
-
188
-
189
-
190
-
191
-
192
-
193
-
194
-
195
-
196
-
197
-
198
-
199
-
200
-
201
-
202
-
203
-
204
-
205
-
206
-
207
-
208
-
209
-
210
-
211
-
212
-
213
-
214
-
215
-
216
-
217
-
218
-
219
-
220
-
221
-
222
-
223
-
224
-
225
-
226
-
227
-
228
-
229
-
230
-
231
-
232
-
233
-
234
-
235
-
236
-
237
-
238
-
239
-
240
-
241
-
242
-
243
-
244
-
245
-
246
-
247
-
248
-
249
-
250
-
251
-
252
-
253
-
254
-
255
-
256
-
257
-
258
-
259
-
260
-
261
-
262
-
263
-
264
-
265
-
266
-
267
-
268
-
269
-
270
-
271
-
272
-
273
-
274
-
275
-
276
-
277
-
278
-
279
-
280
 |
 |

Financial derivatives involve, to varying degrees, interest rate,
market and credit risk. For interest rate swaps and total return
swaps, options and futures contracts, only periodic cash
payments and, with respect to options, premiums are
exchanged. Therefore, cash requirements and exposure to
credit risk are significantly less than the notional amount on
these instruments.
Further information on our financial derivatives is presented
in Note 1 Accounting Policies and Note 17 Financial
Derivatives in the Notes To Consolidated Financial
Statements in Item 8 of this Report, which is incorporated here
by reference.
Not all elements of interest rate, market and credit risk are
addressed through the use of financial or other derivatives,
and such instruments may be ineffective for their intended
purposes due to unanticipated market changes, among other
reasons.
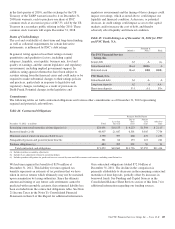
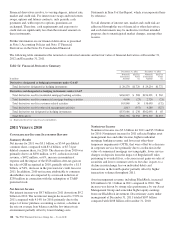
The following table summarizes the notional or contractual amounts and net fair value of financial derivatives at December 31,
2012 and December 31, 2011.
Table 54: Financial Derivatives Summary
December 31, 2012 December 31, 2011
In millions
Notional/
Contractual
Amount
Net Fair
Value
(a)
Notional/
Contractual
Amount
Net Fair
Value
(a)
Derivatives designated as hedging instruments under GAAP
Total derivatives designated as hedging instruments $ 29,270 $1,720 $ 29,234 $1,772
Derivatives not designated as hedging instruments under GAAP
Total derivatives used for residential mortgage banking activities $166,819 $ 588 $196,991 $ 565
Total derivatives used for commercial mortgage banking activities 4,606 (23) 2,720 (21)
Total derivatives used for customer-related activities 163,848 30 158,095 (132)
Total derivatives used for other risk management activities 1,813 (357) 4,289 (327)
Total derivatives not designated as hedging instruments $337,086 $ 238 $362,095 $ 85
Total Derivatives $366,356 $1,958 $391,329 $1,857
(a) Represents the net fair value of assets and liabilities.
2011 V
ERSUS
2010
C
ONSOLIDATED
I
NCOME
S
TATEMENT
R
EVIEW
Summary Results
Net income for 2011 was $3.1 billion, or $5.64 per diluted
common share, compared with $3.4 billion, or $5.74 per
diluted common share, for 2010. The decrease from 2010 was
primarily due to an $850 million, or 6%, reduction in total
revenue, a $492 million, or 6%, increase in noninterest
expense and the impact of the $328 million after-tax gain on
the sale of GIS recognized in 2010, partially offset by a $1.3
billion, or 54%, decrease in the provision for credit losses in
2011. In addition, 2010 net income attributable to common
shareholders was also impacted by a noncash reduction of
$250 million in connection with the redemption of TARP
preferred stock.
Net Interest Income
Net interest income was $8.7 billion for 2011 down from $9.2
billion in 2010. The net interest margin decreased to 3.92% in
2011 compared with 4.14% for 2010, primarily due to the
impact of lower purchase accounting accretion, a decline in
the rate on average loan balances and the low interest rate
environment partially offset by lower funding costs.
Noninterest Income
Noninterest income was $5.6 billion for 2011 and $5.9 billion
for 2010. Noninterest income for 2011 reflected higher asset
management fees and other income, higher residential
mortgage banking revenue, and lower net other-than-
temporary impairments (OTTI), that were offset by a decrease
in corporate service fees primarily due to a reduction in the
value of commercial mortgage servicing rights, lower service
charges on deposits from the impact of Regulation E rules
pertaining to overdraft fees, a decrease in net gains on sales of
securities and lower consumer services fees due, in part, to a
decline in interchange fees on individual debit card
transactions in the fourth quarter partially offset by higher
transaction volumes throughout 2011.
Asset management revenue, including BlackRock, increased
$34 million to $1.1 billion in 2011 compared to 2010. The
increase was driven by strong sales performance by our Asset
Management Group and somewhat higher equity earnings
from our BlackRock investment. Discretionary assets under
management at December 31, 2011 totaled $107 billion
compared with $108 billion at December 31, 2010.
108 The PNC Financial Services Group, Inc. – Form 10-K