PNC Bank 2012 Annual Report Download - page 107
Download and view the complete annual report
Please find page 107 of the 2012 PNC Bank annual report below. You can navigate through the pages in the report by either clicking on the pages listed below, or by using the keyword search tool below to find specific information within the annual report.-
 1
1 -
2
-
3
-
4
-
5
-
6
-
7
-
8
-
9
-
10
-
11
-
12
-
13
-
14
-
15
-
16
-
17
-
18
-
19
-
20
-
21
-
22
-
23
-
24
-
25
-
26
-
27
-
28
-
29
-
30
-
31
-
32
-
33
-
34
-
35
-
36
-
37
-
38
-
39
-
40
-
41
-
42
-
43
-
44
-
45
-
46
-
47
-
48
-
49
-
50
-
51
-
52
-
53
-
54
-
55
-
56
-
57
-
58
-
59
-
60
-
61
-
62
-
63
-
64
-
65
-
66
-
67
-
68
-
69
-
70
-
71
-
72
-
73
-
74
-
75
-
76
-
77
-
78
-
79
-
80
-
81
-
82
-
83
-
84
-
85
-
86
-
87
-
88
-
89
-
90
-
91
-
92
-
93
-
94
-
95
-
96
-
 97
97 -
 98
98 -
 99
99 -
 100
100 -
 101
101 -
 102
102 -
 103
103 -
 104
104 -
 105
105 -
 106
106 -
 107
107 -
 108
108 -
 109
109 -
 110
110 -
 111
111 -
 112
112 -
 113
113 -
 114
114 -
 115
115 -
 116
116 -
 117
117 -
118
-
119
-
120
-
121
-
122
-
123
-
124
-
125
-
126
-
127
-
128
-
129
-
130
-
131
-
132
-
133
-
134
-
135
-
136
-
137
-
138
-
139
-
140
-
141
-
142
-
143
-
144
-
145
-
146
-
147
-
148
-
149
-
150
-
151
-
152
-
153
-
154
-
155
-
156
-
157
-
158
-
159
-
160
-
161
-
162
-
163
-
164
-
165
-
166
-
167
-
168
-
169
-
170
-
171
-
172
-
173
-
174
-
175
-
176
-
177
-
178
-
179
-
180
-
181
-
182
-
183
-
184
-
185
-
186
-
187
-
188
-
189
-
190
-
191
-
192
-
193
-
194
-
195
-
196
-
197
-
198
-
199
-
200
-
201
-
202
-
203
-
204
-
205
-
206
-
207
-
208
-
209
-
210
-
211
-
212
-
213
-
214
-
215
-
216
-
217
-
218
-
219
-
220
-
221
-
222
-
223
-
224
-
225
-
226
-
227
-
228
-
229
-
230
-
231
-
232
-
233
-
234
-
235
-
236
-
237
-
238
-
239
-
240
-
241
-
242
-
243
-
244
-
245
-
246
-
247
-
248
-
249
-
250
-
251
-
252
-
253
-
254
-
255
-
256
-
257
-
258
-
259
-
260
-
261
-
262
-
263
-
264
-
265
-
266
-
267
-
268
-
269
-
270
-
271
-
272
-
273
-
274
-
275
-
276
-
277
-
278
-
279
-
280
 |
 |
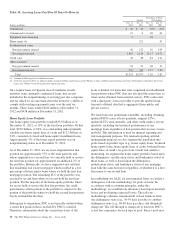
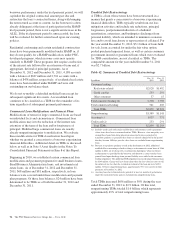
(f) Nonperforming loans exclude certain government insured or guaranteed loans, loans held for sale, loans accounted for under the fair value option and purchased impaired loans.
(g) OREO excludes $380 million and $280 million at December 31, 2012 and December 31, 2011, respectively, related to residential real estate that was acquired by us upon foreclosure
of serviced loans because they are insured by the Federal Housing Administration (FHA) or guaranteed by the Department of Veterans Affairs (VA).
(h) The allowance for loan and lease losses includes impairment reserves attributable to purchased impaired loans. See Note 7 Allowances for Loan and Lease Losses and Unfunded Loan
Commitments and Letters of Credit in the Notes To Consolidated Financial Statements in Item 8 of this Report for additional information.
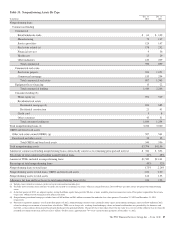
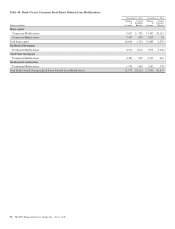
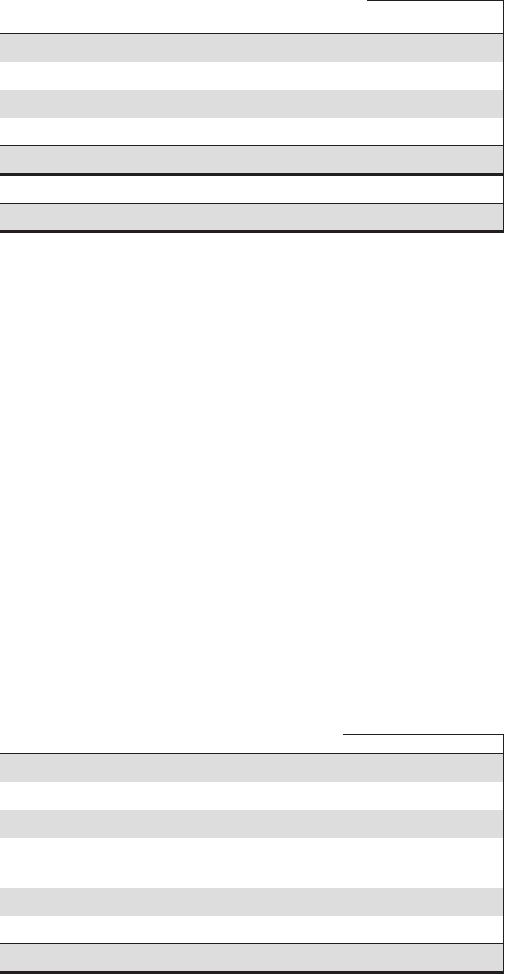
Table 34: OREO and Foreclosed Assets
In millions
Dec. 31
2012
Dec. 31
2011
Other real estate owned (OREO):
Residential properties $167 $191
Residential development properties 135 183
Commercial properties 205 187
Total OREO 507 561
Foreclosed and other assets 33 35
Total OREO and foreclosed assets $540 $596
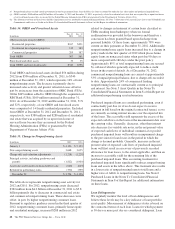
Total OREO and foreclosed assets declined $56 million during
2012 from $596 million at December 31, 2011, to $540
million at December 31, 2012, which represents 14% of total
nonperforming assets. The decrease is primarily due to
increased sales activity and greater valuation losses offset in
part by an increase from the acquisition of RBC Bank (USA).
Of the $245 million added to OREO through the acquisition of
RBC Bank (USA), $109 million remained at December 31,
2012. As of December 31, 2012 and December 31, 2011, 31%
and 32%, respectively, of our OREO and foreclosed assets
were comprised of 1-4 family residential properties. Excluded
from OREO at December 31, 2012 and December 31, 2011,
respectively, was $380 million and $280 million of residential
real estate that was acquired by us upon foreclosure of
serviced loans because they are insured by the Federal
Housing Administration (FHA) or guaranteed by the
Department of Veterans Affairs (VA).
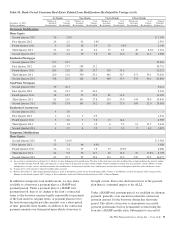
Table 35: Change in Nonperforming Assets
In millions 2012 2011
January 1 $ 4,156 $ 5,123
New nonperforming assets 3,648 3,625
Charge-offs and valuation adjustments (1,218) (1,220)
Principal activity, including paydowns and
payoffs (1,812) (1,960)
Asset sales and transfers to loans held for sale (610) (613)
Returned to performing status (370) (799)
December 31 $ 3,794 $ 4,156
The table above represents nonperforming asset activity for
2012 and 2011. For 2012, nonperforming assets decreased
$362 million from $4.2 billion at December 31, 2011 to $3.8
billion primarily due to decreases in commercial real estate
and commercial nonperforming loans. These decreases were
offset, in part, by higher nonperforming consumer loans.
Pursuant to regulatory guidance issued in the third quarter of
2012, nonperforming consumer loans, primarily home equity
and residential mortgage, increased $288 million in 2012
related to changes in treatment of certain loans classified as
TDRs resulting from bankruptcy where no formal
reaffirmation was provided by the borrower and therefore a
concession has been granted based upon discharge from
personal liability. Of these loans, approximately 78% were
current on their payments at December 31, 2012. Additionally,
nonperforming home equity loans increased due to a change in
policy made in the first quarter of 2012 which places home
equity loans on nonaccrual status when past due 90 days or
more compared with 180 days under the prior policy.
Approximately 85% of total nonperforming loans are secured
by collateral which is generally expected to reduce credit
losses in the event of default. As of December 31, 2012,
commercial nonperforming loans are carried at approximately
53% of unpaid principal balance, due to charge-offs recorded
to date. Approximately 24% of commercial lending
nonperforming loans are contractually current as to principal
and interest. See Note 5 Asset Quality in the Notes To
Consolidated Financial Statements in Item 8 of this Report for
additional nonperforming asset information.
Purchased impaired loans are considered performing, even if
contractually past due (or if we do not expect to receive
payment in full based on the original contractual terms), as we
are currently accreting interest income over the expected life
of the loans. The accretable yield represents the excess of the
expected cash flows on the loans at the measurement date over
the carrying value. Generally, decreases, other than interest
rate decreases for variable rate notes, in the net present value
of expected cash flows of individual commercial or pooled
purchased impaired loans will result in an impairment charge
to the provision for loan losses in the period in which the
change is deemed probable. Generally, increases in the net
present value of expected cash flows of purchased impaired
loans will first result in a recovery of previously recorded
allowance for loan losses, to the extent applicable, and then an
increase to accretable yield for the remaining life of the
purchased impaired loans. This accounting treatment for
purchased impaired loans significantly reduces nonperforming
loans and assets in the tables above. This treatment also results
in a lower ratio of nonperforming loans to total loans and a
higher ratio of ALLL to nonperforming loans. See Note 6
Purchased Loans in the Notes To Consolidated Financial
Statements in Item 8 of this Report for additional information
on these loans.
Loan Delinquencies
We regularly monitor the level of loan delinquencies and
believe these levels may be a key indicator of loan portfolio
asset quality. Measurement of delinquency status is based on
the contractual terms of each loan. Loans for which payment
is 30 days or more past due are considered delinquent. Loan
88 The PNC Financial Services Group, Inc. – Form 10-K