PNC Bank 2012 Annual Report Download - page 159
Download and view the complete annual report
Please find page 159 of the 2012 PNC Bank annual report below. You can navigate through the pages in the report by either clicking on the pages listed below, or by using the keyword search tool below to find specific information within the annual report.-
 1
1 -
2
-
3
-
4
-
5
-
6
-
7
-
8
-
9
-
10
-
11
-
12
-
13
-
14
-
15
-
16
-
17
-
18
-
19
-
20
-
21
-
22
-
23
-
24
-
25
-
26
-
27
-
28
-
29
-
30
-
31
-
32
-
33
-
34
-
35
-
36
-
37
-
38
-
39
-
40
-
41
-
42
-
43
-
44
-
45
-
46
-
47
-
48
-
49
-
50
-
51
-
52
-
53
-
54
-
55
-
56
-
57
-
58
-
59
-
60
-
61
-
62
-
63
-
64
-
65
-
66
-
67
-
68
-
69
-
70
-
71
-
72
-
73
-
74
-
75
-
76
-
77
-
78
-
79
-
80
-
81
-
82
-
83
-
84
-
85
-
86
-
87
-
88
-
89
-
90
-
91
-
92
-
93
-
94
-
95
-
96
-
97
-
98
-
99
-
100
-
101
-
102
-
103
-
104
-
105
-
106
-
107
-
108
-
109
-
110
-
111
-
112
-
113
-
114
-
115
-
116
-
117
-
118
-
119
-
120
-
121
-
122
-
123
-
124
-
125
-
126
-
127
-
128
-
129
-
130
-
131
-
132
-
133
-
134
-
135
-
136
-
137
-
138
-
139
-
140
-
141
-
142
-
143
-
144
-
145
-
146
-
147
-
148
-
 149
149 -
 150
150 -
 151
151 -
 152
152 -
 153
153 -
 154
154 -
 155
155 -
 156
156 -
 157
157 -
 158
158 -
 159
159 -
 160
160 -
 161
161 -
 162
162 -
 163
163 -
 164
164 -
 165
165 -
 166
166 -
 167
167 -
 168
168 -
 169
169 -
170
-
171
-
172
-
173
-
174
-
175
-
176
-
177
-
178
-
179
-
180
-
181
-
182
-
183
-
184
-
185
-
186
-
187
-
188
-
189
-
190
-
191
-
192
-
193
-
194
-
195
-
196
-
197
-
198
-
199
-
200
-
201
-
202
-
203
-
204
-
205
-
206
-
207
-
208
-
209
-
210
-
211
-
212
-
213
-
214
-
215
-
216
-
217
-
218
-
219
-
220
-
221
-
222
-
223
-
224
-
225
-
226
-
227
-
228
-
229
-
230
-
231
-
232
-
233
-
234
-
235
-
236
-
237
-
238
-
239
-
240
-
241
-
242
-
243
-
244
-
245
-
246
-
247
-
248
-
249
-
250
-
251
-
252
-
253
-
254
-
255
-
256
-
257
-
258
-
259
-
260
-
261
-
262
-
263
-
264
-
265
-
266
-
267
-
268
-
269
-
270
-
271
-
272
-
273
-
274
-
275
-
276
-
277
-
278
-
279
-
280
 |
 |

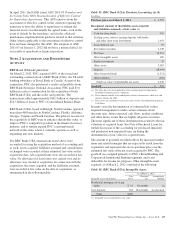
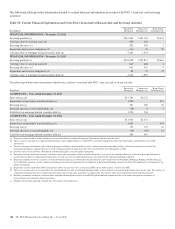
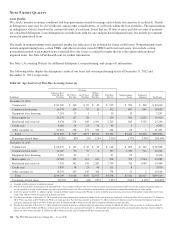
The following table provides information related to certain financial information associated with PNC’s loan sale and servicing
activities:
Table 58: Certain Financial Information and Cash Flows Associated with Loan Sale and Servicing Activities
In millions Residential
Mortgages
Commercial
Mortgages (a)
Home Equity
Loans/Lines (b)
FINANCIAL INFORMATION – December 31, 2012
Servicing portfolio (c) $119,262 $153,193 $5,353
Carrying value of servicing assets (d) 650 420
Servicing advances (e) 582 505 5
Repurchase and recourse obligations (f) 614 43 58
Carrying value of mortgage-backed securities held (g) 5,445 1,533
FINANCIAL INFORMATION – December 31, 2011
Servicing portfolio (c) $118,058 $155,813 $5,661
Carrying value of servicing assets (d) 647 468 1
Servicing advances (e) 563 510 8
Repurchase and recourse obligations (f) 83 47 47
Carrying value of mortgage-backed securities held (g) 4,654 1,839
The following table provides information related to the cash flows associated with PNC’s loan sale and servicing activities:
In millions
Residential
Mortgages
Commercial
Mortgages (a)
Home Equity
Loans/Lines (b)
CASH FLOWS – Year ended December 31, 2012
Sales of loans (h) $13,783 $2,172
Repurchases of previously transferred loans (i) 1,500 $21
Servicing fees (j) 383 180 22
Servicing advances recovered/(funded), net (19) 6 3
Cash flows on mortgage-backed securities held (g) 1,220 536
CASH FLOWS – Year ended December 31, 2011
Sales of loans (h) $11,920 $2,351
Repurchases of previously transferred loans (i) 1,683 $42
Servicing fees (j) 355 179 22
Servicing advances recovered/(funded), net (30) (95) 12
Cash flows on mortgage-backed securities held (g) 586 419
(a) Represents financial and cash flow information associated with both commercial mortgage loan transfer and servicing activities.
(b) These activities were part of an acquired brokered home equity lending business in which PNC is no longer engaged. See Note 24 Commitments and Guarantees for further
information.
(c) For our continuing involvement with residential mortgage and home equity loan/line transfers, amount represents outstanding balance of loans transferred and serviced. For
commercial mortgages, amount represents overall servicing portfolio in which loans have been transferred by us or third parties to VIEs.
(d) See Note 9 Fair Value and Note 10 Goodwill and Other Intangible Assets for further information.
(e) Pursuant to certain contractual servicing agreements, represents outstanding balance of funds advanced (i) to investors for monthly collections of borrower principal and interest,
(ii) for borrower draws on unused home equity lines of credit, and (iii) for collateral protection associated with the underlying mortgage collateral.
(f) Represents liability for our loss exposure associated with loan repurchases for breaches of representations and warranties for our Residential Mortgage Banking and Non-Strategic
Assets Portfolio segments, and our commercial mortgage loss share arrangements for our Corporate & Institutional Banking segment. See Note 24 Commitments and Guarantees for
further information.
(g) Represents securities held where PNC transferred to and/or services loans for a securitization SPE and we hold securities issued by that SPE.
(h) There were no gains or losses recognized on the transaction date for sales of residential mortgage loans as these loans are recognized on the balance sheet at fair value. For transfers of
commercial mortgage loans not recognized on the balance sheet at fair value, gains/losses recognized on sales of these loans were insignificant for the periods presented.
(i) Includes government insured or guaranteed loans repurchased through the exercise of our ROAP option and loans repurchased due to breaches of origination covenants or
representations and warranties made to purchasers.
(j) Includes contractually specified servicing fees, late charges and ancillary fees.
140 The PNC Financial Services Group, Inc. – Form 10-K