PNC Bank 2012 Annual Report Download - page 182
Download and view the complete annual report
Please find page 182 of the 2012 PNC Bank annual report below. You can navigate through the pages in the report by either clicking on the pages listed below, or by using the keyword search tool below to find specific information within the annual report.-
 1
1 -
2
-
3
-
4
-
5
-
6
-
7
-
8
-
9
-
10
-
11
-
12
-
13
-
14
-
15
-
16
-
17
-
18
-
19
-
20
-
21
-
22
-
23
-
24
-
25
-
26
-
27
-
28
-
29
-
30
-
31
-
32
-
33
-
34
-
35
-
36
-
37
-
38
-
39
-
40
-
41
-
42
-
43
-
44
-
45
-
46
-
47
-
48
-
49
-
50
-
51
-
52
-
53
-
54
-
55
-
56
-
57
-
58
-
59
-
60
-
61
-
62
-
63
-
64
-
65
-
66
-
67
-
68
-
69
-
70
-
71
-
72
-
73
-
74
-
75
-
76
-
77
-
78
-
79
-
80
-
81
-
82
-
83
-
84
-
85
-
86
-
87
-
88
-
89
-
90
-
91
-
92
-
93
-
94
-
95
-
96
-
97
-
98
-
99
-
100
-
101
-
102
-
103
-
104
-
105
-
106
-
107
-
108
-
109
-
110
-
111
-
112
-
113
-
114
-
115
-
116
-
117
-
118
-
119
-
120
-
121
-
122
-
123
-
124
-
125
-
126
-
127
-
128
-
129
-
130
-
131
-
132
-
133
-
134
-
135
-
136
-
137
-
138
-
139
-
140
-
141
-
142
-
143
-
144
-
145
-
146
-
147
-
148
-
149
-
150
-
151
-
152
-
153
-
154
-
155
-
156
-
157
-
158
-
159
-
160
-
161
-
162
-
163
-
164
-
165
-
166
-
167
-
168
-
169
-
170
-
171
-
 172
172 -
 173
173 -
 174
174 -
 175
175 -
 176
176 -
 177
177 -
 178
178 -
 179
179 -
 180
180 -
 181
181 -
 182
182 -
 183
183 -
 184
184 -
 185
185 -
 186
186 -
 187
187 -
 188
188 -
 189
189 -
 190
190 -
 191
191 -
 192
192 -
193
-
194
-
195
-
196
-
197
-
198
-
199
-
200
-
201
-
202
-
203
-
204
-
205
-
206
-
207
-
208
-
209
-
210
-
211
-
212
-
213
-
214
-
215
-
216
-
217
-
218
-
219
-
220
-
221
-
222
-
223
-
224
-
225
-
226
-
227
-
228
-
229
-
230
-
231
-
232
-
233
-
234
-
235
-
236
-
237
-
238
-
239
-
240
-
241
-
242
-
243
-
244
-
245
-
246
-
247
-
248
-
249
-
250
-
251
-
252
-
253
-
254
-
255
-
256
-
257
-
258
-
259
-
260
-
261
-
262
-
263
-
264
-
265
-
266
-
267
-
268
-
269
-
270
-
271
-
272
-
273
-
274
-
275
-
276
-
277
-
278
-
279
-
280
 |
 |

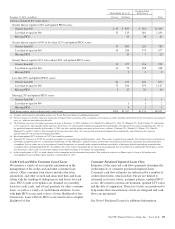
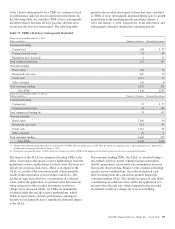
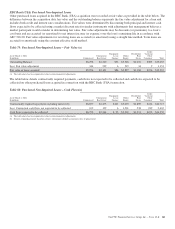
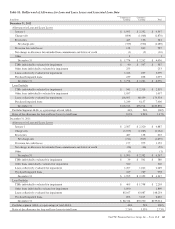
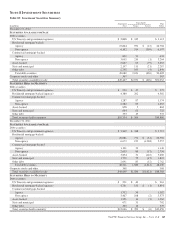
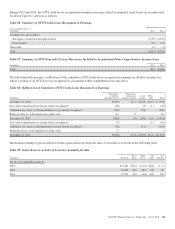
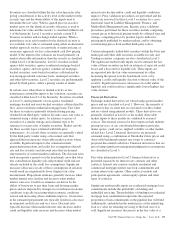
Table 81: Rollforward of Allowance for Loan and Lease Losses and Associated Loan Data
In millions
Commercial
Lending
Consumer
Lending Total
December 31, 2012
Allowance for Loan and Lease Losses
January 1 $ 1,995 $ 2,352 $ 4,347
Charge-offs (804) (1,066) (1,870)
Recoveries 445 136 581
Net charge-offs (359) (930) (1,289)
Provision for credit losses 138 849 987
Net change in allowance for unfunded loan commitments and letters of credit (1) (9) (10)
Other 11
December 31 $ 1,774 $ 2,262 $ 4,036
TDRs individually evaluated for impairment $ 40 $ 547 $ 587
Other loans individually evaluated for impairment 253 253
Loans collectively evaluated for impairment 1,242 857 2,099
Purchased impaired loans 239 858 1,097
December 31 $ 1,774 $ 2,262 $ 4,036
Loan Portfolio
TDRs individually evaluated for impairment $ 541 $ 2,318 $ 2,859
Other loans individually evaluated for impairment 1,057 1,057
Loans collectively evaluated for impairment 106,095 68,439 174,534
Purchased impaired loans 1,249 6,157 7,406
December 31 $108,942 $76,914 $185,856
Portfolio Segment ALLL as a percentage of total ALLL 44% 56% 100%
Ratio of the allowance for loan and lease losses to total loans 1.63% 2.94% 2.17%
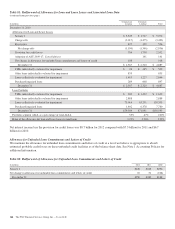
December 31, 2011
Allowance for Loan and Lease Losses
January 1 $ 2,567 $ 2,320 $ 4,887
Charge-offs (1,199) (1,065) (2,264)
Recoveries 487 138 625
Net charge-offs (712) (927) (1,639)
Provision for credit losses 177 975 1,152
Net change in allowance for unfunded loan commitments and letters of credit (36) (16) (52)
Other (1) (1)
December 31 $ 1,995 $ 2,352 $ 4,347
TDRs individually evaluated for impairment $ 39 $ 541 $ 580
Other loans individually evaluated for impairment 520 520
Loans collectively evaluated for impairment 1,207 1,042 2,249
Purchased impaired loans 229 769 998
December 31 $ 1,995 $ 2,352 $ 4,347
Loan Portfolio
TDRs individually evaluated for impairment $ 405 $ 1,798 $ 2,203
Other loans individually evaluated for impairment 1,890 1,890
Loans collectively evaluated for impairment 85,167 63,087 148,254
Purchased impaired loans 852 5,815 6,667
December 31 $ 88,314 $70,700 $159,014
Portfolio segment ALLL as a percentage of total ALLL 46% 54% 100%
Ratio of the allowance for loan and lease losses to total loans 2.26% 3.33% 2.73%
The PNC Financial Services Group, Inc. – Form 10-K 163