PNC Bank 2012 Annual Report Download - page 123
Download and view the complete annual report
Please find page 123 of the 2012 PNC Bank annual report below. You can navigate through the pages in the report by either clicking on the pages listed below, or by using the keyword search tool below to find specific information within the annual report.-
 1
1 -
2
-
3
-
4
-
5
-
6
-
7
-
8
-
9
-
10
-
11
-
12
-
13
-
14
-
15
-
16
-
17
-
18
-
19
-
20
-
21
-
22
-
23
-
24
-
25
-
26
-
27
-
28
-
29
-
30
-
31
-
32
-
33
-
34
-
35
-
36
-
37
-
38
-
39
-
40
-
41
-
42
-
43
-
44
-
45
-
46
-
47
-
48
-
49
-
50
-
51
-
52
-
53
-
54
-
55
-
56
-
57
-
58
-
59
-
60
-
61
-
62
-
63
-
64
-
65
-
66
-
67
-
68
-
69
-
70
-
71
-
72
-
73
-
74
-
75
-
76
-
77
-
78
-
79
-
80
-
81
-
82
-
83
-
84
-
85
-
86
-
87
-
88
-
89
-
90
-
91
-
92
-
93
-
94
-
95
-
96
-
97
-
98
-
99
-
100
-
101
-
102
-
103
-
104
-
105
-
106
-
107
-
108
-
109
-
110
-
111
-
112
-
 113
113 -
 114
114 -
 115
115 -
 116
116 -
 117
117 -
 118
118 -
 119
119 -
 120
120 -
 121
121 -
 122
122 -
 123
123 -
 124
124 -
 125
125 -
 126
126 -
 127
127 -
 128
128 -
 129
129 -
 130
130 -
 131
131 -
 132
132 -
 133
133 -
134
-
135
-
136
-
137
-
138
-
139
-
140
-
141
-
142
-
143
-
144
-
145
-
146
-
147
-
148
-
149
-
150
-
151
-
152
-
153
-
154
-
155
-
156
-
157
-
158
-
159
-
160
-
161
-
162
-
163
-
164
-
165
-
166
-
167
-
168
-
169
-
170
-
171
-
172
-
173
-
174
-
175
-
176
-
177
-
178
-
179
-
180
-
181
-
182
-
183
-
184
-
185
-
186
-
187
-
188
-
189
-
190
-
191
-
192
-
193
-
194
-
195
-
196
-
197
-
198
-
199
-
200
-
201
-
202
-
203
-
204
-
205
-
206
-
207
-
208
-
209
-
210
-
211
-
212
-
213
-
214
-
215
-
216
-
217
-
218
-
219
-
220
-
221
-
222
-
223
-
224
-
225
-
226
-
227
-
228
-
229
-
230
-
231
-
232
-
233
-
234
-
235
-
236
-
237
-
238
-
239
-
240
-
241
-
242
-
243
-
244
-
245
-
246
-
247
-
248
-
249
-
250
-
251
-
252
-
253
-
254
-
255
-
256
-
257
-
258
-
259
-
260
-
261
-
262
-
263
-
264
-
265
-
266
-
267
-
268
-
269
-
270
-
271
-
272
-
273
-
274
-
275
-
276
-
277
-
278
-
279
-
280
 |
 |

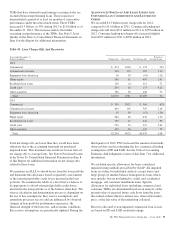
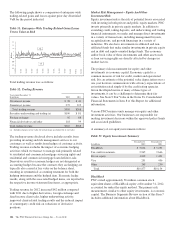
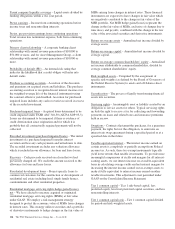
Table 47: Other Commitments (a)
Amount Of Commitment Expiration By Period
December 31, 2012 – in millions
Total
Amounts
Committed
Less than
one year
One to
three
years
Four to
five years
After
five
years
Net unfunded credit commitments $120,592 $51,017 $38,038 $31,060 $ 477
Standby letters of credit (b) 11,467 5,200 4,823 1,417 27
Reinsurance agreements (c) 5,846 2,835 66 33 2,912
Other commitments (d) 918 602 255 58 3
Total commitments $138,823 $59,654 $43,182 $32,568 $3,419
(a) Other commitments are funding commitments that could potentially require performance in the event of demands by third parties or contingent events. Loan commitments are reported
net of syndications, assignments and participations.
(b) Includes $7.5 billion of standby letters of credit that support remarketing programs for customers’ variable rate demand notes.
(c) Reinsurance agreements are with third-party insurers related to insurance sold to our customers. Balances represent estimates based on availability of financial information.
(d) Includes unfunded commitments related to private equity investments of $182 million and other investments of $3 million that are not on our Consolidated Balance Sheet. Also
includes commitments related to tax credit investments of $685 million and other direct equity investments of $48 million that are included in Other liabilities on our Consolidated
Balance Sheet.
M
ARKET
R
ISK
M
ANAGEMENT
Market risk is the risk of a loss in earnings or economic value
due to adverse movements in market factors such as interest
rates, credit spreads, foreign exchange rates, and equity prices.
We are exposed to market risk primarily by our involvement
in the following activities, among others:
• Traditional banking activities of taking deposits and
extending loans,
• Equity and other investments and activities whose
economic values are directly impacted by market
factors, and
• Fixed income, equities, derivatives, and foreign
exchange activities, as a result of customer activities
and underwriting.
We have established enterprise-wide policies and
methodologies to identify, measure, monitor, and report
market risk. Market Risk Management provides independent
oversight by monitoring compliance with these limits and
guidelines, and reporting significant risks in the business to
the Risk Committee of the Board.
Market Risk Management – Interest Rate Risk
Interest rate risk results primarily from our traditional banking
activities of gathering deposits and extending loans. Many
factors, including economic and financial conditions,
movements in interest rates, and consumer preferences, affect
the difference between the interest that we earn on assets and
the interest that we pay on liabilities and the level of our
noninterest-bearing funding sources. Due to the repricing term
mismatches and embedded options inherent in certain of these
products, changes in market interest rates not only affect
expected near-term earnings, but also the economic values of
these assets and liabilities.
Asset and Liability Management centrally manages interest
rate risk as prescribed in our risk management policies, which
are approved by management’s Asset and Liability Committee
and the Risk Committee of the Board.
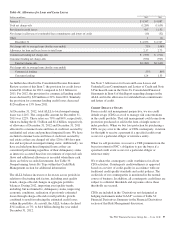
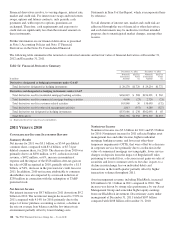
Sensitivity results and market interest rate benchmarks for the
fourth quarters of 2012 and 2011 follow:
Table 48: Interest Sensitivity Analysis
Fourth
Quarter
2012
Fourth
Quarter
2011
Net Interest Income Sensitivity Simulation
Effect on net interest income in first year
from gradual interest rate change over
following 12 months of:
100 basis point increase 2.0% 2.3%
100 basis point decrease (a) (1.3)% (1.5)%
Effect on net interest income in second
year from gradual interest rate change
over the preceding 12 months of:
100 basis point increase 6.8% 7.1%
100 basis point decrease (a) (4.8)% (4.4)%
Duration of Equity Model (a)
Base case duration of equity (in years): (7.3) (6.2)
Key Period-End Interest Rates
One-month LIBOR .21% .30%
Three-year swap .50% .82%
(a) Given the inherent limitations in certain of these measurement tools and techniques,
results become less meaningful as interest rates approach zero.
104 The PNC Financial Services Group, Inc. – Form 10-K