PNC Bank 2012 Annual Report Download - page 126
Download and view the complete annual report
Please find page 126 of the 2012 PNC Bank annual report below. You can navigate through the pages in the report by either clicking on the pages listed below, or by using the keyword search tool below to find specific information within the annual report.-
 1
1 -
2
-
3
-
4
-
5
-
6
-
7
-
8
-
9
-
10
-
11
-
12
-
13
-
14
-
15
-
16
-
17
-
18
-
19
-
20
-
21
-
22
-
23
-
24
-
25
-
26
-
27
-
28
-
29
-
30
-
31
-
32
-
33
-
34
-
35
-
36
-
37
-
38
-
39
-
40
-
41
-
42
-
43
-
44
-
45
-
46
-
47
-
48
-
49
-
50
-
51
-
52
-
53
-
54
-
55
-
56
-
57
-
58
-
59
-
60
-
61
-
62
-
63
-
64
-
65
-
66
-
67
-
68
-
69
-
70
-
71
-
72
-
73
-
74
-
75
-
76
-
77
-
78
-
79
-
80
-
81
-
82
-
83
-
84
-
85
-
86
-
87
-
88
-
89
-
90
-
91
-
92
-
93
-
94
-
95
-
96
-
97
-
98
-
99
-
100
-
101
-
102
-
103
-
104
-
105
-
106
-
107
-
108
-
109
-
110
-
111
-
112
-
113
-
114
-
115
-
 116
116 -
 117
117 -
 118
118 -
 119
119 -
 120
120 -
 121
121 -
 122
122 -
 123
123 -
 124
124 -
 125
125 -
 126
126 -
 127
127 -
 128
128 -
 129
129 -
 130
130 -
 131
131 -
 132
132 -
 133
133 -
 134
134 -
 135
135 -
 136
136 -
137
-
138
-
139
-
140
-
141
-
142
-
143
-
144
-
145
-
146
-
147
-
148
-
149
-
150
-
151
-
152
-
153
-
154
-
155
-
156
-
157
-
158
-
159
-
160
-
161
-
162
-
163
-
164
-
165
-
166
-
167
-
168
-
169
-
170
-
171
-
172
-
173
-
174
-
175
-
176
-
177
-
178
-
179
-
180
-
181
-
182
-
183
-
184
-
185
-
186
-
187
-
188
-
189
-
190
-
191
-
192
-
193
-
194
-
195
-
196
-
197
-
198
-
199
-
200
-
201
-
202
-
203
-
204
-
205
-
206
-
207
-
208
-
209
-
210
-
211
-
212
-
213
-
214
-
215
-
216
-
217
-
218
-
219
-
220
-
221
-
222
-
223
-
224
-
225
-
226
-
227
-
228
-
229
-
230
-
231
-
232
-
233
-
234
-
235
-
236
-
237
-
238
-
239
-
240
-
241
-
242
-
243
-
244
-
245
-
246
-
247
-
248
-
249
-
250
-
251
-
252
-
253
-
254
-
255
-
256
-
257
-
258
-
259
-
260
-
261
-
262
-
263
-
264
-
265
-
266
-
267
-
268
-
269
-
270
-
271
-
272
-
273
-
274
-
275
-
276
-
277
-
278
-
279
-
280
 |
 |
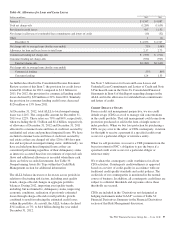
Tax Credit Investments
Included in our equity investments are tax credit investments
which are accounted for under the equity method. These
investments, as well as equity investments held by
consolidated partnerships, totaled $3.0 billion at December 31,
2012 and $2.6 billion at December 31, 2011. These equity
investment balances include unfunded commitments totaling
$685 million and $420 million, respectively. These unfunded
commitments are included in Other Liabilities on our
Consolidated Balance Sheet.
Note 3 Loan Sale and Servicing Activities and Variable
Interest Entities in the Notes To Consolidated Financial
Statements in Item 8 of this Report has further information on
Tax Credit Investments.
Private Equity
The private equity portfolio is an illiquid portfolio comprised
of mezzanine and equity investments that vary by industry,
stage and type of investment.
Private equity investments carried at estimated fair value
totaled $1.8 billion at December 31, 2012 and $1.5 billion at
December 31, 2011. As of December 31, 2012, $1.2 billion
was invested directly in a variety of companies and $.6 billion
was invested indirectly through various private equity funds.
Included in direct investments are investment activities of two
private equity funds that are consolidated for financial
reporting purposes. The noncontrolling interests of these funds
totaled $266 million as of December 31, 2012. The indirect
private equity funds are not redeemable, but PNC receives
distributions over the life of the partnership from liquidation
of the underlying investments by the investee. See Item 1
Business – Supervision and Regulation and Item 1A Risk
Factors of this Report for discussion of potential impacts of
the Volcker Rule provisions of Dodd-Frank on our holding
interests in and sponsorship of private equity or hedge funds.
Our unfunded commitments related to private equity totaled
$182 million at December 31, 2012 compared with $247
million at December 31, 2011.
Visa
In 2012, we sold 9 million of Visa Class B common shares
and entered into swap agreements with the purchaser of the
shares. See Note 9 Fair Value and Note 17 Financial
Derivatives in the Notes To Consolidated Financial
Statements in Item 8 of this Report for additional information.
At December 31, 2012, our investment in Visa Class B
common shares totaled approximately 14 million shares and
was recorded at $251 million. Based on the December 31,
2012 closing price of $151.58 for the Visa Class A common
shares, the fair value of our total investment was
approximately $916 million at the current conversion rate
which reflects adjustments in respect of all litigation funding
by Visa to date. The Visa Class B common shares that we own
are transferable only under limited circumstances (including
those applicable to the sales in 2012) until they can be
converted into shares of the publicly traded class of stock,
which cannot happen until the settlement of all of the
specified litigation. It is expected that Visa will continue to
adjust the conversion rate of Visa Class B common shares to
Class A common shares in connection with any settlements of
the specified litigation in excess of any amounts then in
escrow for that purpose and will also reduce the conversion
rate to the extent that it adds any funds to the escrow in the
future.
Note 24 Commitments and Guarantees in the Notes To
Consolidated Financial Statements in Item 8 of this Report has
further information on our Visa indemnification obligation.
Other Investments
We also make investments in affiliated and non-affiliated
funds with both traditional and alternative investment
strategies. The economic values could be driven by either the
fixed-income market or the equity markets, or both. At
December 31, 2012, other investments totaled $245 million
compared with $250 million at December 31, 2011. We
recognized net gains related to these investments of $55
million during 2012, compared with $1 million during 2011.
Given the nature of these investments, if market conditions
affecting their valuation were to worsen, we could incur future
losses.
Our unfunded commitments related to other investments
totaled $3 million at both December 31, 2012 and
December 31, 2011.
Impact of Inflation
Our assets and liabilities are primarily financial in nature and
typically have varying maturity dates. Accordingly, future
changes in prices do not affect the obligations to pay or
receive fixed and determinable amounts of money. However,
during periods of inflation, there may be a subsequent impact
affecting certain fixed costs or expenses, an erosion of
consumer and customer purchasing power, and fluctuations in
the need or demand for our products and services. Should
significant levels of inflation occur, our business could
potentially be impacted by, among other things, reducing our
tolerance for extending credit or causing us to incur additional
credit losses resulting from possible increased default rates.
Financial Derivatives
We use a variety of financial derivatives as part of the overall
asset and liability risk management process to help manage
exposure to interest rate, market and credit risk inherent in our
business activities. Substantially all such instruments are used
to manage risk related to changes in interest rates. Interest rate
and total return swaps, interest rate caps and floors, swaptions,
options, forwards and futures contracts are the primary
instruments we use for interest rate risk management. We also
enter into derivatives with customers to facilitate their risk
management activities.
The PNC Financial Services Group, Inc. – Form 10-K 107