PNC Bank 2012 Annual Report Download - page 89
Download and view the complete annual report
Please find page 89 of the 2012 PNC Bank annual report below. You can navigate through the pages in the report by either clicking on the pages listed below, or by using the keyword search tool below to find specific information within the annual report.-
 1
1 -
2
-
3
-
4
-
5
-
6
-
7
-
8
-
9
-
10
-
11
-
12
-
13
-
14
-
15
-
16
-
17
-
18
-
19
-
20
-
21
-
22
-
23
-
24
-
25
-
26
-
27
-
28
-
29
-
30
-
31
-
32
-
33
-
34
-
35
-
36
-
37
-
38
-
39
-
40
-
41
-
42
-
43
-
44
-
45
-
46
-
47
-
48
-
49
-
50
-
51
-
52
-
53
-
54
-
55
-
56
-
57
-
58
-
59
-
60
-
61
-
62
-
63
-
64
-
65
-
66
-
67
-
68
-
69
-
70
-
71
-
72
-
73
-
74
-
75
-
76
-
77
-
78
-
 79
79 -
 80
80 -
 81
81 -
 82
82 -
 83
83 -
 84
84 -
 85
85 -
 86
86 -
 87
87 -
 88
88 -
 89
89 -
 90
90 -
 91
91 -
 92
92 -
 93
93 -
 94
94 -
 95
95 -
 96
96 -
 97
97 -
 98
98 -
 99
99 -
100
-
101
-
102
-
103
-
104
-
105
-
106
-
107
-
108
-
109
-
110
-
111
-
112
-
113
-
114
-
115
-
116
-
117
-
118
-
119
-
120
-
121
-
122
-
123
-
124
-
125
-
126
-
127
-
128
-
129
-
130
-
131
-
132
-
133
-
134
-
135
-
136
-
137
-
138
-
139
-
140
-
141
-
142
-
143
-
144
-
145
-
146
-
147
-
148
-
149
-
150
-
151
-
152
-
153
-
154
-
155
-
156
-
157
-
158
-
159
-
160
-
161
-
162
-
163
-
164
-
165
-
166
-
167
-
168
-
169
-
170
-
171
-
172
-
173
-
174
-
175
-
176
-
177
-
178
-
179
-
180
-
181
-
182
-
183
-
184
-
185
-
186
-
187
-
188
-
189
-
190
-
191
-
192
-
193
-
194
-
195
-
196
-
197
-
198
-
199
-
200
-
201
-
202
-
203
-
204
-
205
-
206
-
207
-
208
-
209
-
210
-
211
-
212
-
213
-
214
-
215
-
216
-
217
-
218
-
219
-
220
-
221
-
222
-
223
-
224
-
225
-
226
-
227
-
228
-
229
-
230
-
231
-
232
-
233
-
234
-
235
-
236
-
237
-
238
-
239
-
240
-
241
-
242
-
243
-
244
-
245
-
246
-
247
-
248
-
249
-
250
-
251
-
252
-
253
-
254
-
255
-
256
-
257
-
258
-
259
-
260
-
261
-
262
-
263
-
264
-
265
-
266
-
267
-
268
-
269
-
270
-
271
-
272
-
273
-
274
-
275
-
276
-
277
-
278
-
279
-
280
 |
 |
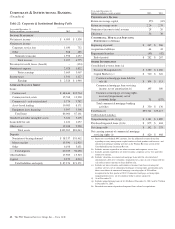
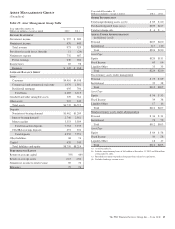
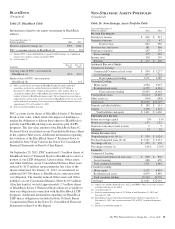
This business segment consists primarily of non-strategic
assets obtained through acquisitions of other companies. Non-
Strategic Assets Portfolio had earnings of $237 million in
2012 compared with $200 million in 2011. The increase was
primarily attributable to a lower provision for credit losses,
partially offset by lower net interest income driven by declines
in loan balances and purchase accounting accretion.
2012 included the impact of the RBC Bank (USA) acquisition,
which added approximately $1.0 billion of residential real
estate loans, $.2 billion of commercial/commercial real estate
loans and $.2 billion of OREO assets. Of these assets, $1.0
billion were deemed purchased impaired loans.
Non-Strategic Assets Portfolio overview:
• Net interest income was $830 million in 2012
compared with $913 million 2011. The decrease was
driven by lower purchase accounting accretion and
loan balances.
• Noninterest income was $13 million in 2012
compared with $47 million 2011. The decline was
driven mainly by larger valuation adjustments to
liabilities for estimated repurchase losses on home
equity loans sold.
• The provision for credit losses was $181 million in
2012 compared with $366 million in 2011. The
decrease in the provision for credit losses reflected a
declining loan portfolio and improvement in asset
quality.
• Noninterest expense in 2012 was $287 million
compared with $275 million in 2011. The increase
was primarily due to higher other real estate owned
expenses.
• Average portfolio loans declined to $12.4 billion in
2012 compared with $13.4 billion in 2011. The
overall decline was driven by customer payment
activity and portfolio management activities to
reduce under-performing assets partially offset by the
addition of loans from the RBC Bank (USA)
acquisition.
• Nonperforming loans were $.7 billion as of
December 31, 2012 and December 31, 2011. The
consumer lending portfolio comprised 80% of
nonperforming loans at December 31, 2012.
Nonperforming consumer loans increased $83
million from December 31, 2011 as a result of a
change in the nonaccrual policy for home equity
loans requiring loans to be placed on nonaccrual at
90 days past due compared to the prior policy of 180
days. Also contributing to the increase was a change
in the treatment of certain consumer loans classified
as TDRs, pursuant to regulatory guidance issued in
the third quarter of 2012. These TDRs resulted from
bankruptcy where no formal reaffirmation was
provided by the borrower thereby granting a
concession upon discharge from personal liability.
• Net charge-offs were $299 million in 2012 and $370
million in 2011. Net charge-offs declined 17% on the
consumer lending portfolio and 23% on the
commercial lending portfolio.
The business activity of this segment is to manage the wind-
down of the portfolio assigned to it while maximizing the
value and mitigating risk. The fair value marks taken upon
acquisition of the assets, the team we have in place, and
targeted asset resolution strategies help us to manage these
assets.
• The Commercial Lending portfolio declined 18% to
$1.35 billion at December 31, 2012 compared to
December 31, 2011. Loans to residential developers
declined 32% to $.7 billion while the lease financing
portfolio remained relatively flat at $.7 billion. The
leases are long-term with relatively low credit risk.
• The Consumer Lending portfolio declined $.4 billion,
or 4%, when compared to the same period last year.
Excluding $.9 billion of residential mortgage loans
from the RBC Bank (USA) acquisition, the portfolio
decreased 13%. The portfolio’s credit quality has
stabilized through actions taken by management. We
have implemented various refinance programs, line
management programs, and loss mitigation programs
to mitigate risks within this portfolio while assisting
borrowers to maintain homeownership when
possible.
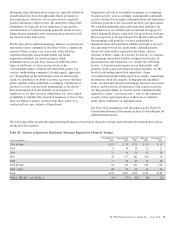
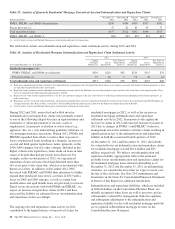
• When loans are sold, we may assume certain loan
repurchase obligations to indemnify investors against
losses or to repurchase loans that they believe do not
comply with applicable contractual loan origination
covenants and representations and warranties we
have made. From 2005 to 2007, home equity loans
were sold with such contractual provisions. At
December 31, 2012, the liability for estimated losses
on repurchase and indemnification claims for the
Non-Strategic Assets Portfolio was $58 million
compared to $47 million at December 31, 2011. See
the Recourse And Repurchase Obligations section of
this Item 7 and Note 24 Commitments and
Guarantees in the Notes To Consolidated Financial
Statements included in Item 8 of this Report for
additional information.
70 The PNC Financial Services Group, Inc. – Form 10-K