PNC Bank 2012 Annual Report Download - page 108
Download and view the complete annual report
Please find page 108 of the 2012 PNC Bank annual report below. You can navigate through the pages in the report by either clicking on the pages listed below, or by using the keyword search tool below to find specific information within the annual report.-
 1
1 -
2
-
3
-
4
-
5
-
6
-
7
-
8
-
9
-
10
-
11
-
12
-
13
-
14
-
15
-
16
-
17
-
18
-
19
-
20
-
21
-
22
-
23
-
24
-
25
-
26
-
27
-
28
-
29
-
30
-
31
-
32
-
33
-
34
-
35
-
36
-
37
-
38
-
39
-
40
-
41
-
42
-
43
-
44
-
45
-
46
-
47
-
48
-
49
-
50
-
51
-
52
-
53
-
54
-
55
-
56
-
57
-
58
-
59
-
60
-
61
-
62
-
63
-
64
-
65
-
66
-
67
-
68
-
69
-
70
-
71
-
72
-
73
-
74
-
75
-
76
-
77
-
78
-
79
-
80
-
81
-
82
-
83
-
84
-
85
-
86
-
87
-
88
-
89
-
90
-
91
-
92
-
93
-
94
-
95
-
96
-
97
-
 98
98 -
 99
99 -
 100
100 -
 101
101 -
 102
102 -
 103
103 -
 104
104 -
 105
105 -
 106
106 -
 107
107 -
 108
108 -
 109
109 -
 110
110 -
 111
111 -
 112
112 -
 113
113 -
 114
114 -
 115
115 -
 116
116 -
 117
117 -
 118
118 -
119
-
120
-
121
-
122
-
123
-
124
-
125
-
126
-
127
-
128
-
129
-
130
-
131
-
132
-
133
-
134
-
135
-
136
-
137
-
138
-
139
-
140
-
141
-
142
-
143
-
144
-
145
-
146
-
147
-
148
-
149
-
150
-
151
-
152
-
153
-
154
-
155
-
156
-
157
-
158
-
159
-
160
-
161
-
162
-
163
-
164
-
165
-
166
-
167
-
168
-
169
-
170
-
171
-
172
-
173
-
174
-
175
-
176
-
177
-
178
-
179
-
180
-
181
-
182
-
183
-
184
-
185
-
186
-
187
-
188
-
189
-
190
-
191
-
192
-
193
-
194
-
195
-
196
-
197
-
198
-
199
-
200
-
201
-
202
-
203
-
204
-
205
-
206
-
207
-
208
-
209
-
210
-
211
-
212
-
213
-
214
-
215
-
216
-
217
-
218
-
219
-
220
-
221
-
222
-
223
-
224
-
225
-
226
-
227
-
228
-
229
-
230
-
231
-
232
-
233
-
234
-
235
-
236
-
237
-
238
-
239
-
240
-
241
-
242
-
243
-
244
-
245
-
246
-
247
-
248
-
249
-
250
-
251
-
252
-
253
-
254
-
255
-
256
-
257
-
258
-
259
-
260
-
261
-
262
-
263
-
264
-
265
-
266
-
267
-
268
-
269
-
270
-
271
-
272
-
273
-
274
-
275
-
276
-
277
-
278
-
279
-
280
 |
 |

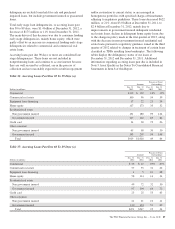
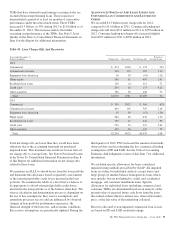
delinquencies exclude loans held for sale and purchased
impaired loans, but include government insured or guaranteed
loans.
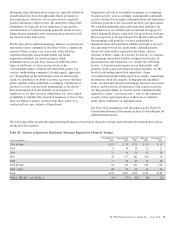
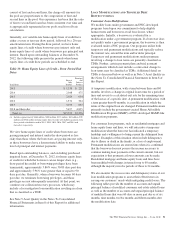
Total early stage loan delinquencies, or accruing loans past
due 30 to 89 days, were $1.4 billion at December 31, 2012, a
decrease of $175 million or 11% from December 31, 2011.
The main driver of this decrease was due to consumer lending
early stage delinquencies, mainly home equity, which were
partly offset by an increase in commercial lending early stage
delinquencies related to commercial and commercial real
estate loans.
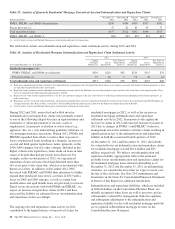
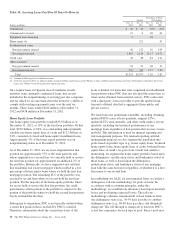
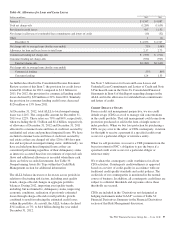
Accruing loans past due 90 days or more are considered late
stage delinquencies. These loans are not included in
nonperforming loans and continue to accrue interest because
they are well secured by collateral, are in the process of
collection and are reasonably expected to result in repayment
and/or restoration to current status, or are managed in
homogenous portfolios with specified charge-off timeframes
adhering to regulatory guidelines. These loans decreased $622
million, or 21%, from $3.0 billion at December 31, 2011, to
$2.4 billion at December 31, 2012, mainly due to
improvements in government insured delinquent residential
real estate loans, decline in delinquent home equity loans due
to the change in policy made in the first quarter of 2012, along
with the decrease in non government insured residential real
estate loans pursuant to regulatory guidance issued in the third
quarter of 2012 related to changes in treatment of certain loans
classified as TDRs resulting from bankruptcy. The following
tables display the delinquency status of our loans at
December 31, 2012 and December 31, 2011. Additional
information regarding accruing loans past due is included in
Note 5 Asset Quality in the Notes To Consolidated Financial
Statements in Item 8 of this Report.
Table 36: Accruing Loans Past Due 30 To 59 Days (a)
Amount
Percent of Total
Outstandings
Dollars in millions
Dec. 31
2012
Dec. 31
2011
Dec. 31
2012
Dec. 31
2011
Commercial $115 $ 122 .14% .19%
Commercial real estate 100 96 .54 .59
Equipment lease financing 17 22 .23 .34
Home equity 117 173 .33 .52
Residential real estate
Non government insured 151 180 .99 1.24
Government insured 127 122 .83 .84
Credit card 34 38 .79 .96
Other consumer
Non government insured 65 58 .30 .30
Government insured 193 207 .90 1.08
Total $919 $1,018 .49 .64
Table 37: Accruing Loans Past Due 60 To 89 Days (a)
Amount
Percent of Total
Outstandings
Dollars in millions
Dec. 31
2012
Dec. 31
2011
Dec. 31
2012
Dec. 31
2011
Commercial $ 55 $ 47 .07% .07%
Commercial real estate 57 35 .31 .22
Equipment lease financing 1 5 .01 .08
Home equity 58 114 .16 .34
Residential real estate
Non government insured 49 72 .32 .50
Government insured 97 104 .64 .72
Credit card 23 25 .53 .63
Other consumer
Non government insured 21 21 .10 .11
Government insured 110 124 .51 .65
Total $471 $547 .25 .34
The PNC Financial Services Group, Inc. – Form 10-K 89