PNC Bank 2012 Annual Report Download - page 109
Download and view the complete annual report
Please find page 109 of the 2012 PNC Bank annual report below. You can navigate through the pages in the report by either clicking on the pages listed below, or by using the keyword search tool below to find specific information within the annual report.-
 1
1 -
2
-
3
-
4
-
5
-
6
-
7
-
8
-
9
-
10
-
11
-
12
-
13
-
14
-
15
-
16
-
17
-
18
-
19
-
20
-
21
-
22
-
23
-
24
-
25
-
26
-
27
-
28
-
29
-
30
-
31
-
32
-
33
-
34
-
35
-
36
-
37
-
38
-
39
-
40
-
41
-
42
-
43
-
44
-
45
-
46
-
47
-
48
-
49
-
50
-
51
-
52
-
53
-
54
-
55
-
56
-
57
-
58
-
59
-
60
-
61
-
62
-
63
-
64
-
65
-
66
-
67
-
68
-
69
-
70
-
71
-
72
-
73
-
74
-
75
-
76
-
77
-
78
-
79
-
80
-
81
-
82
-
83
-
84
-
85
-
86
-
87
-
88
-
89
-
90
-
91
-
92
-
93
-
94
-
95
-
96
-
97
-
98
-
 99
99 -
 100
100 -
 101
101 -
 102
102 -
 103
103 -
 104
104 -
 105
105 -
 106
106 -
 107
107 -
 108
108 -
 109
109 -
 110
110 -
 111
111 -
 112
112 -
 113
113 -
 114
114 -
 115
115 -
 116
116 -
 117
117 -
 118
118 -
 119
119 -
120
-
121
-
122
-
123
-
124
-
125
-
126
-
127
-
128
-
129
-
130
-
131
-
132
-
133
-
134
-
135
-
136
-
137
-
138
-
139
-
140
-
141
-
142
-
143
-
144
-
145
-
146
-
147
-
148
-
149
-
150
-
151
-
152
-
153
-
154
-
155
-
156
-
157
-
158
-
159
-
160
-
161
-
162
-
163
-
164
-
165
-
166
-
167
-
168
-
169
-
170
-
171
-
172
-
173
-
174
-
175
-
176
-
177
-
178
-
179
-
180
-
181
-
182
-
183
-
184
-
185
-
186
-
187
-
188
-
189
-
190
-
191
-
192
-
193
-
194
-
195
-
196
-
197
-
198
-
199
-
200
-
201
-
202
-
203
-
204
-
205
-
206
-
207
-
208
-
209
-
210
-
211
-
212
-
213
-
214
-
215
-
216
-
217
-
218
-
219
-
220
-
221
-
222
-
223
-
224
-
225
-
226
-
227
-
228
-
229
-
230
-
231
-
232
-
233
-
234
-
235
-
236
-
237
-
238
-
239
-
240
-
241
-
242
-
243
-
244
-
245
-
246
-
247
-
248
-
249
-
250
-
251
-
252
-
253
-
254
-
255
-
256
-
257
-
258
-
259
-
260
-
261
-
262
-
263
-
264
-
265
-
266
-
267
-
268
-
269
-
270
-
271
-
272
-
273
-
274
-
275
-
276
-
277
-
278
-
279
-
280
 |
 |
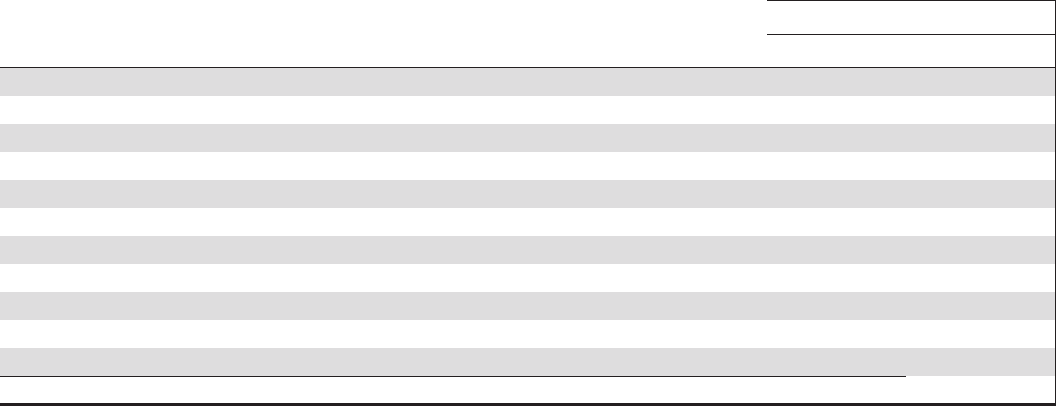
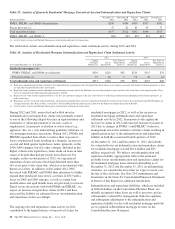
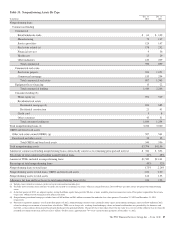
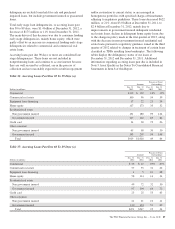
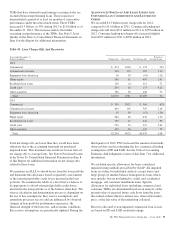
Table 38: Accruing Loans Past Due 90 Days Or More (a)
Amount
Percentage of Total
Outstandings
Dollars in millions
Dec. 31
2012
Dec. 31
2011
Dec. 31
2012
Dec. 31
2011
Commercial $ 42 $ 49 .05% .07%
Commercial real estate 15 6 .08 .04
Equipment lease financing 2 .03
Home equity (b) 221 .67
Residential real estate
Non government insured 46 152 .30 1.05
Government insured 1,855 2,129 12.17 14.71
Credit card 36 48 .84 1.21
Other consumer
Non government insured 18 23 .08 .12
Government insured 337 345 1.57 1.80
Total $2,351 $2,973 1.26 1.87
(a) Amounts in table represent recorded investment.
(b) In the first quarter of 2012, we adopted a policy stating that Home equity loans past due 90 days or more would be placed on nonaccrual status. Prior policy required that these loans
be past due 180 days before being placed on nonaccrual status.
On a regular basis our Special Asset Committee closely
monitors loans, primarily commercial loans, that are not
included in the nonperforming or accruing past due categories
and for which we are uncertain about the borrower’s ability to
comply with existing repayment terms over the next six
months. These loans totaled $242 million at December 31,
2012 and $438 million at December 31, 2011.
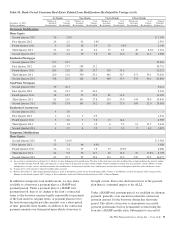
Home Equity Loan Portfolio
Our home equity loan portfolio totaled $35.9 billion as of
December 31, 2012, or 19% of the total loan portfolio. Of that
total, $23.6 billion, or 66%, was outstanding under primarily
variable-rate home equity lines of credit and $12.3 billion, or
34%, consisted of closed-end home equity installment loans.
Approximately 3% of the home equity portfolio was on
nonperforming status as of December 31, 2012.
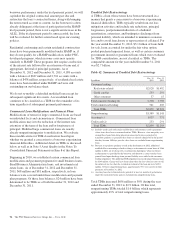
As of December 31, 2012, we are in an originated first lien
position for approximately 37% of the total portfolio and,
where originated as a second lien, we currently hold or service
the first lien position for approximately an additional 2% of
the portfolio. Historically, we have originated and sold first
lien residential real estate mortgages which resulted in a low
percentage of home equity loans where we hold the first lien
mortgage position. The remaining 61% of the portfolio was
secured by second liens where we do not hold the first lien
position. For the majority of the home equity portfolio where
we are in, hold or service the first lien position, the credit
performance of this portion of the portfolio is superior to the
portion of the portfolio where we hold the second lien position
but do not hold the first lien.
Subsequent to origination, PNC is not typically notified when
a senior lien position that is not held by PNC is satisfied.
Therefore, information about the current lien status of the
loans is limited, for loans that were originated in subordinated
lien positions where PNC does not also hold the senior lien, to
what can be obtained from external sources. PNC contracted
with a third-party service provider to provide updated loan,
lien and collateral data that is aggregated from public and
private sources.
We track borrower performance monthly, including obtaining
updated FICO scores at least quarterly, original LTVs,
updated LTVs semi-annually, and other credit metrics at least
quarterly, including the historical performance of any
mortgage loans regardless of lien position that we may or may
not hold. This information is used for internal reporting and
risk management purposes. For internal reporting and risk
management purposes we also segment the population into
pools based on product type (e.g., home equity loans, brokered
home equity loans, home equity lines of credit, brokered home
equity lines of credit). As part of our overall risk analytics
monitoring, we segment the home equity portfolio based upon
the delinquency, modification status, and bankruptcy status of
these loans, as well as based upon the delinquency,
modification status, and bankruptcy status of any mortgage
loan with the same borrower (regardless of whether it is a first
lien senior to our second lien).
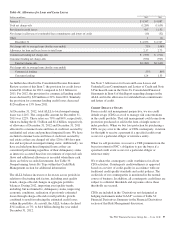
In establishing our ALLL for non-impaired loans, we utilize a
delinquency roll-rate methodology for pools of loans. In
accordance with accounting principles, under this
methodology, we establish our allowance based upon incurred
losses and not lifetime expected losses. The roll-rate
methodology estimates transition/roll of loan balances from
one delinquency state (e.g., 30-59 days past due) to another
delinquency state (e.g., 60-89 days past due), and ultimately
charge-off. The roll through to charge-off is based on PNC’s
actual loss experience for each type of pool. Since a pool may
90 The PNC Financial Services Group, Inc. – Form 10-K