PNC Bank 2012 Annual Report Download - page 261
Download and view the complete annual report
Please find page 261 of the 2012 PNC Bank annual report below. You can navigate through the pages in the report by either clicking on the pages listed below, or by using the keyword search tool below to find specific information within the annual report.-
 1
1 -
2
-
3
-
4
-
5
-
6
-
7
-
8
-
9
-
10
-
11
-
12
-
13
-
14
-
15
-
16
-
17
-
18
-
19
-
20
-
21
-
22
-
23
-
24
-
25
-
26
-
27
-
28
-
29
-
30
-
31
-
32
-
33
-
34
-
35
-
36
-
37
-
38
-
39
-
40
-
41
-
42
-
43
-
44
-
45
-
46
-
47
-
48
-
49
-
50
-
51
-
52
-
53
-
54
-
55
-
56
-
57
-
58
-
59
-
60
-
61
-
62
-
63
-
64
-
65
-
66
-
67
-
68
-
69
-
70
-
71
-
72
-
73
-
74
-
75
-
76
-
77
-
78
-
79
-
80
-
81
-
82
-
83
-
84
-
85
-
86
-
87
-
88
-
89
-
90
-
91
-
92
-
93
-
94
-
95
-
96
-
97
-
98
-
99
-
100
-
101
-
102
-
103
-
104
-
105
-
106
-
107
-
108
-
109
-
110
-
111
-
112
-
113
-
114
-
115
-
116
-
117
-
118
-
119
-
120
-
121
-
122
-
123
-
124
-
125
-
126
-
127
-
128
-
129
-
130
-
131
-
132
-
133
-
134
-
135
-
136
-
137
-
138
-
139
-
140
-
141
-
142
-
143
-
144
-
145
-
146
-
147
-
148
-
149
-
150
-
151
-
152
-
153
-
154
-
155
-
156
-
157
-
158
-
159
-
160
-
161
-
162
-
163
-
164
-
165
-
166
-
167
-
168
-
169
-
170
-
171
-
172
-
173
-
174
-
175
-
176
-
177
-
178
-
179
-
180
-
181
-
182
-
183
-
184
-
185
-
186
-
187
-
188
-
189
-
190
-
191
-
192
-
193
-
194
-
195
-
196
-
197
-
198
-
199
-
200
-
201
-
202
-
203
-
204
-
205
-
206
-
207
-
208
-
209
-
210
-
211
-
212
-
213
-
214
-
215
-
216
-
217
-
218
-
219
-
220
-
221
-
222
-
223
-
224
-
225
-
226
-
227
-
228
-
229
-
230
-
231
-
232
-
233
-
234
-
235
-
236
-
237
-
238
-
239
-
240
-
241
-
242
-
243
-
244
-
245
-
246
-
247
-
248
-
249
-
250
-
 251
251 -
 252
252 -
 253
253 -
 254
254 -
 255
255 -
 256
256 -
 257
257 -
 258
258 -
 259
259 -
 260
260 -
 261
261 -
 262
262 -
 263
263 -
 264
264 -
 265
265 -
 266
266 -
 267
267 -
 268
268 -
 269
269 -
 270
270 -
 271
271 -
272
-
273
-
274
-
275
-
276
-
277
-
278
-
279
-
280
 |
 |

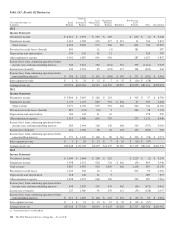
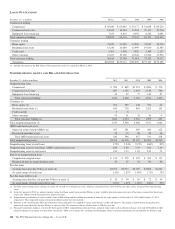
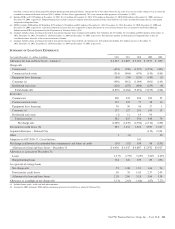
The following table presents the assignment of the allowance for loan and lease losses and the categories of loans as a percentage
of total loans. Changes in the allocation over time reflect the changes in loan portfolio composition, risk profile and refinements to
reserve methodologies. For purposes of this presentation, a portion of the allowance for loan and lease losses has been assigned to
loan categories based on the relative specific and pool allocation amounts to provide coverage for probable losses not covered in
specific, pool and consumer reserve methodologies related to qualitative and measurement factors. At December 31, 2012, the
portion of the reserves for these factors was $42 million.
A
LLOCATION OF
A
LLOWANCE FOR
L
OAN AND
L
EASE
L
OSSES
2012 2011 2010 2009 2008
December 31
Dollars in millions Allowance
Loans to
Total Loans Allowance
Loans to
Total Loans Allowance
Loans to
Total Loans Allowance
Loans to
Total Loans Allowance
Loans to
Total Loans
Commercial $1,131 44.7% $1,180 41.3% $1,387 36.7% $1,869 34.8% $1,668 39.4%
Commercial real estate 589 10.0 753 10.2 1,086 11.9 1,305 14.7 833 14.7
Equipment lease
financing 54 3.9 62 4.0 94 4.2 171 3.9 179 3.7
Consumer (a) 1,415 33.2 1,458 35.4 1,227 36.6 957 34.0 929 29.9
Residential real estate 847 8.2 894 9.1 1,093 10.6 770 12.6 308 12.3
Total $4,036 100.0% $4,347 100.0% $4,887 100.0% $5,072 100.0% $3,917 100.0%
(a) Includes home equity, credit card and other consumer.
S
ELECTED
L
OAN
M
ATURITIES AND
I
NTEREST
S
ENSITIVITY
December 31, 2012
In millions
1 Year
or Less
1 Through
5 Years
After
5 Years
Gross
Loans
Commercial $22,804 $48,428 $11,808 $ 83,040
Commercial real estate –
Real estate projects 6,575 8,070 4,010 18,655
Total $29,379 $56,498 $15,818 $101,695
Loans with:
Predetermined rate $ 5,458 $11,320 $ 7,855 $ 24,633
Floating or adjustable
rate 23,921 45,178 7,963 77,062
Total $29,379 $56,498 $15,818 $101,695
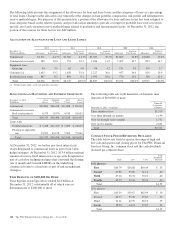
At December 31, 2012, we had no pay-fixed interest rate
swaps designated to commercial loans as part of fair value
hedge strategies. At December 31, 2012, $13.4 billion notional
amount of receive-fixed interest rate swaps were designated as
part of cash flow hedging strategies that converted the floating
rate (1 month and 3 month LIBOR) on the underlying
commercial loans to a fixed rate as part of risk management
strategies.
T
IME
D
EPOSITS OF
$100,000 O
R
M
ORE
Time deposits in foreign offices totaled $2.0 billion at
December 31, 2012, substantially all of which were in
denominations of $100,000 or more.
The following table sets forth maturities of domestic time
deposits of $100,000 or more:
December 31, 2012 – in millions
Domestic
Certificates
of Deposit
Three months or less $1,719
Over three through six months 1,190
Over six through twelve months 1,731
Over twelve months 2,691
Total $7,331
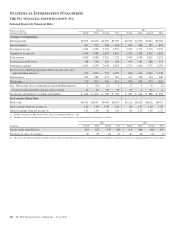
C
OMMON
S
TOCK
P
RICES
/D
IVIDENDS
D
ECLARED
The table below sets forth by quarter the range of high and
low sale and quarter-end closing prices for The PNC Financial
Services Group, Inc. common stock and the cash dividends
declared per common share.
High Low Close
Cash
Dividends
Declared
2012 Quarter
First $64.79 $56.88 $64.49 $ .35
Second 67.89 55.60 61.11 .40
Third 67.04 56.76 63.10 .40
Fourth 65.73 53.36 58.31 .40
Total $1.55
2011 Quarter
First $65.19 $59.67 $62.99 $ .10
Second 64.37 55.56 59.61 .35
Third 61.21 42.70 48.19 .35
Fourth 58.70 44.74 57.67 .35
Total $1.15
242 The PNC Financial Services Group, Inc. – Form 10-K