PNC Bank 2012 Annual Report Download - page 207
Download and view the complete annual report
Please find page 207 of the 2012 PNC Bank annual report below. You can navigate through the pages in the report by either clicking on the pages listed below, or by using the keyword search tool below to find specific information within the annual report.-
 1
1 -
2
-
3
-
4
-
5
-
6
-
7
-
8
-
9
-
10
-
11
-
12
-
13
-
14
-
15
-
16
-
17
-
18
-
19
-
20
-
21
-
22
-
23
-
24
-
25
-
26
-
27
-
28
-
29
-
30
-
31
-
32
-
33
-
34
-
35
-
36
-
37
-
38
-
39
-
40
-
41
-
42
-
43
-
44
-
45
-
46
-
47
-
48
-
49
-
50
-
51
-
52
-
53
-
54
-
55
-
56
-
57
-
58
-
59
-
60
-
61
-
62
-
63
-
64
-
65
-
66
-
67
-
68
-
69
-
70
-
71
-
72
-
73
-
74
-
75
-
76
-
77
-
78
-
79
-
80
-
81
-
82
-
83
-
84
-
85
-
86
-
87
-
88
-
89
-
90
-
91
-
92
-
93
-
94
-
95
-
96
-
97
-
98
-
99
-
100
-
101
-
102
-
103
-
104
-
105
-
106
-
107
-
108
-
109
-
110
-
111
-
112
-
113
-
114
-
115
-
116
-
117
-
118
-
119
-
120
-
121
-
122
-
123
-
124
-
125
-
126
-
127
-
128
-
129
-
130
-
131
-
132
-
133
-
134
-
135
-
136
-
137
-
138
-
139
-
140
-
141
-
142
-
143
-
144
-
145
-
146
-
147
-
148
-
149
-
150
-
151
-
152
-
153
-
154
-
155
-
156
-
157
-
158
-
159
-
160
-
161
-
162
-
163
-
164
-
165
-
166
-
167
-
168
-
169
-
170
-
171
-
172
-
173
-
174
-
175
-
176
-
177
-
178
-
179
-
180
-
181
-
182
-
183
-
184
-
185
-
186
-
187
-
188
-
189
-
190
-
191
-
192
-
193
-
194
-
195
-
196
-
 197
197 -
 198
198 -
 199
199 -
 200
200 -
 201
201 -
 202
202 -
 203
203 -
 204
204 -
 205
205 -
 206
206 -
 207
207 -
 208
208 -
 209
209 -
 210
210 -
 211
211 -
 212
212 -
 213
213 -
 214
214 -
 215
215 -
 216
216 -
 217
217 -
218
-
219
-
220
-
221
-
222
-
223
-
224
-
225
-
226
-
227
-
228
-
229
-
230
-
231
-
232
-
233
-
234
-
235
-
236
-
237
-
238
-
239
-
240
-
241
-
242
-
243
-
244
-
245
-
246
-
247
-
248
-
249
-
250
-
251
-
252
-
253
-
254
-
255
-
256
-
257
-
258
-
259
-
260
-
261
-
262
-
263
-
264
-
265
-
266
-
267
-
268
-
269
-
270
-
271
-
272
-
273
-
274
-
275
-
276
-
277
-
278
-
279
-
280
 |
 |

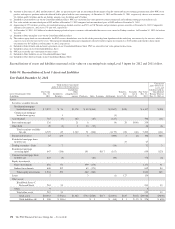
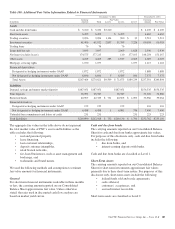
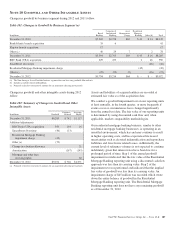
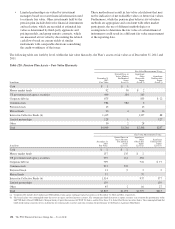
The gross carrying amount, accumulated amortization and net
carrying amount of other intangible assets by major category
consisted of the following:
Table 103: Other Intangible Assets
In millions
December 31
2012
December 31
2011
Customer-related and other
intangibles
Gross carrying amount $1,676 $1,525
Accumulated amortization (950) (783)
Net carrying amount $ 726 $ 742
Mortgage and other loan servicing
rights
Gross carrying amount $2,071 $2,009
Valuation allowance (176) (197)
Accumulated amortization (824) (695)
Net carrying amount $1,071 $1,117
Total $1,797 $1,859
Our other intangible assets have finite lives and are amortized
primarily on a straight-line basis. Core deposit intangibles are
amortized on an accelerated basis.
For customer-related and other intangibles, the estimated
remaining useful lives range from 1 year to 11 years, with a
weighted-average remaining useful life of 8 years.
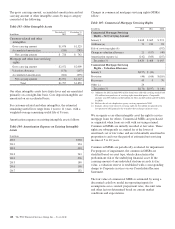
Amortization expense on existing intangible assets follows:
Table 104: Amortization Expense on Existing Intangible
Assets
In millions
2010 $304
2011 324
2012 310
2013 243
2014 206
2015 180
2016 156
2017 132
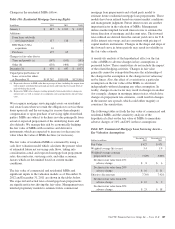
Changes in commercial mortgage servicing rights (MSRs)
follow:
Table 105: Commercial Mortgage Servicing Rights
In millions 2012 2011 2010
Commercial Mortgage Servicing
Rights – Net Carrying Amount
January 1 $ 468 $ 665 $ 921
Additions (a) 73 120 83
Sale of servicing rights (b) (192)
Change in valuation allowance 21 (157) (40)
Amortization expense (c) (142) (160) (107)
December 31 $ 420 $ 468 $ 665
Commercial Mortgage Servicing
Rights – Valuation Allowance
January 1 $(197) $ (40)
Provision (46) (166) $(110)
Recoveries 43 9 70
Other (c) 24
December 31 $(176) $(197) $ (40)
(a) Additions for 2012 included $45 million from loans sold with servicing retained and
$28 million from purchases of servicing rights from third parties. Comparable
amounts were $55 million and $65 million for 2011 and $45 million and $38 million
for 2010.
(b) Reflects the sale of a duplicative agency servicing operation in 2010.
(c) Includes a direct write-down of servicing rights for $24 million recognized in the
first quarter of 2012 primarily due to market-driven changes in interest rates.
We recognize as an other intangible asset the right to service
mortgage loans for others. Commercial MSRs are purchased
or originated when loans are sold with servicing retained.
Commercial MSRs are initially recorded at fair value. These
rights are subsequently accounted for at the lower of
amortized cost or fair value, and are substantially amortized in
proportion to and over the period of estimated net servicing
income of 5 to 10 years.
Commercial MSRs are periodically evaluated for impairment.
For purposes of impairment, the commercial MSRs are
stratified based on asset type, which characterizes the
predominant risk of the underlying financial asset. If the
carrying amount of any individual stratum exceeds its fair
value, a valuation reserve is established with a corresponding
charge to Corporate services on our Consolidated Income
Statement.
The fair value of commercial MSRs is estimated by using a
discounted cash flow model incorporating inputs for
assumptions as to constant prepayment rates, discount rates
and other factors determined based on current market
conditions and expectations.
188 The PNC Financial Services Group, Inc. – Form 10-K