PNC Bank 2012 Annual Report Download - page 75
Download and view the complete annual report
Please find page 75 of the 2012 PNC Bank annual report below. You can navigate through the pages in the report by either clicking on the pages listed below, or by using the keyword search tool below to find specific information within the annual report.-
 1
1 -
2
-
3
-
4
-
5
-
6
-
7
-
8
-
9
-
10
-
11
-
12
-
13
-
14
-
15
-
16
-
17
-
18
-
19
-
20
-
21
-
22
-
23
-
24
-
25
-
26
-
27
-
28
-
29
-
30
-
31
-
32
-
33
-
34
-
35
-
36
-
37
-
38
-
39
-
40
-
41
-
42
-
43
-
44
-
45
-
46
-
47
-
48
-
49
-
50
-
51
-
52
-
53
-
54
-
55
-
56
-
57
-
58
-
59
-
60
-
61
-
62
-
63
-
64
-
 65
65 -
 66
66 -
 67
67 -
 68
68 -
 69
69 -
 70
70 -
 71
71 -
 72
72 -
 73
73 -
 74
74 -
 75
75 -
 76
76 -
 77
77 -
 78
78 -
 79
79 -
 80
80 -
 81
81 -
 82
82 -
 83
83 -
 84
84 -
 85
85 -
86
-
87
-
88
-
89
-
90
-
91
-
92
-
93
-
94
-
95
-
96
-
97
-
98
-
99
-
100
-
101
-
102
-
103
-
104
-
105
-
106
-
107
-
108
-
109
-
110
-
111
-
112
-
113
-
114
-
115
-
116
-
117
-
118
-
119
-
120
-
121
-
122
-
123
-
124
-
125
-
126
-
127
-
128
-
129
-
130
-
131
-
132
-
133
-
134
-
135
-
136
-
137
-
138
-
139
-
140
-
141
-
142
-
143
-
144
-
145
-
146
-
147
-
148
-
149
-
150
-
151
-
152
-
153
-
154
-
155
-
156
-
157
-
158
-
159
-
160
-
161
-
162
-
163
-
164
-
165
-
166
-
167
-
168
-
169
-
170
-
171
-
172
-
173
-
174
-
175
-
176
-
177
-
178
-
179
-
180
-
181
-
182
-
183
-
184
-
185
-
186
-
187
-
188
-
189
-
190
-
191
-
192
-
193
-
194
-
195
-
196
-
197
-
198
-
199
-
200
-
201
-
202
-
203
-
204
-
205
-
206
-
207
-
208
-
209
-
210
-
211
-
212
-
213
-
214
-
215
-
216
-
217
-
218
-
219
-
220
-
221
-
222
-
223
-
224
-
225
-
226
-
227
-
228
-
229
-
230
-
231
-
232
-
233
-
234
-
235
-
236
-
237
-
238
-
239
-
240
-
241
-
242
-
243
-
244
-
245
-
246
-
247
-
248
-
249
-
250
-
251
-
252
-
253
-
254
-
255
-
256
-
257
-
258
-
259
-
260
-
261
-
262
-
263
-
264
-
265
-
266
-
267
-
268
-
269
-
270
-
271
-
272
-
273
-
274
-
275
-
276
-
277
-
278
-
279
-
280
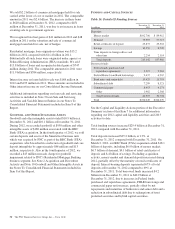
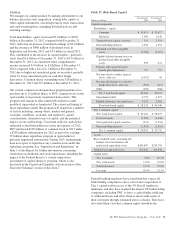
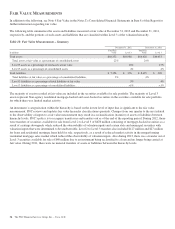
 |
 |
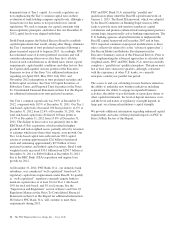
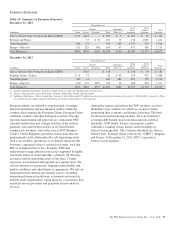
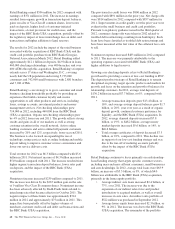
Direct exposure primarily consists of loans, leases, securities,
derivatives, letters of credit and unfunded contractual
commitments with European entities. As of December 31,
2012, the $1.9 billion of funded direct exposure (.61% of
PNC’s total assets) primarily represented $645 million for
cross-border leases in support of national infrastructure, which
were supported by letters of credit and other collateral having
trigger mechanisms that require replacement or collateral in
the form of cash or United States Treasury or government
securities, $600 million for United Kingdom foreign office
loans and $168 million of securities issued by AAA-rated
sovereigns. The comparable level of direct exposure
outstanding at December 31, 2011 was $1.6 billion (.59% of
PNC’s total assets), which primarily included $625 million for
cross-border leases in support of national infrastructure, $382
million for United Kingdom foreign office loans and $357
million of securities issued by AAA-rated sovereigns.
The $550 million of unfunded direct exposure as of
December 31, 2012 was largely comprised of $449 million for
unfunded contractual commitments primarily for United
Kingdom local office commitments to PNC Business Credit
corporate customers on a secured basis or activities supporting
our domestic customers export activities through the
confirmation of trade letters of credit. Comparably, the $485
million of unfunded direct exposure as of December 31, 2011
was largely comprised of $440 million for unfunded
contractual commitments primarily for United Kingdom local
office commitments to PNC Business Credit corporate
customers on a secured basis.
We also track European financial exposures where our clients,
primarily U.S. entities, appoint PNC as a letter of credit
issuing bank and we elect to assume the joint probability of
default risk. As of December 31, 2012 and December 31,
2011, PNC had $2.5 billion and $2.3 billion, respectively, of
indirect exposure. For PNC to incur a loss in these indirect
exposures, both the obligor and the financial counterparty
participating bank would need to default. PNC assesses both
the corporate customers and the participating banks for
counterparty risk and where PNC has found that a
participating bank exposes PNC to unacceptable risk, PNC
will reject the participating bank as an acceptable counterparty
and will ask the corporate customer to find an acceptable
participating bank.
Direct and indirect exposure to entities in the GIIPS countries
totaled $241 million as of December 31, 2012, of which $122
million was direct exposure for cross-border leases within
Portugal, $67 million represented direct exposure for loans
outstanding within Ireland and $31 million represented
indirect exposure for letters of credit with strong underlying
obligors, primarily U.S. entities, with participating banks in
Ireland, Italy and Spain. The comparable amounts as of
December 31, 2011 were total direct and indirect exposure of
$181 million, consisting of $118 million of direct exposure for
cross-border leases within Portugal, indirect exposure of $48
million for letters of credit with strong underlying obligors,
primarily U.S. entities, with participating banks in Ireland,
Italy and Spain and $15 million for unfunded contractual
commitments in Spain.
Direct and indirect exposure to entities in Belgium and France
totaled $1.2 billion as of December 31, 2012. Direct exposure
of $138 million primarily consisted of $69 million for cross-
border leases within Belgium, $35 million for unfunded
contractual commitments in France and $30 million of
covered bonds issued by a financial institution in France.
Indirect exposure was $1.1 billion for letters of credit with
strong underlying obligors, primarily U.S. entities, with
creditworthy participant banks in France and Belgium. The
comparable amounts as of December 31, 2011 were total
direct and indirect exposure of $1.1 billion as of December 31,
2011 of which there was $154 million of direct exposure
primarily consisting of $75 million for cross-border leases
within Belgium and $62 million for unfunded contractual
commitments in France. In addition, direct exposure at
December 31, 2011 included $11 million for 90% Overseas
Private Investment Corporation (“OPIC”) guaranteed Turkish
loans. Indirect exposure at December 31, 2011 was $935
million for letters of credit with strong underlying obligors
and creditworthy participant banks in France and Belgium.
56 The PNC Financial Services Group, Inc. – Form 10-K