PNC Bank 2012 Annual Report Download - page 157
Download and view the complete annual report
Please find page 157 of the 2012 PNC Bank annual report below. You can navigate through the pages in the report by either clicking on the pages listed below, or by using the keyword search tool below to find specific information within the annual report.-
 1
1 -
2
-
3
-
4
-
5
-
6
-
7
-
8
-
9
-
10
-
11
-
12
-
13
-
14
-
15
-
16
-
17
-
18
-
19
-
20
-
21
-
22
-
23
-
24
-
25
-
26
-
27
-
28
-
29
-
30
-
31
-
32
-
33
-
34
-
35
-
36
-
37
-
38
-
39
-
40
-
41
-
42
-
43
-
44
-
45
-
46
-
47
-
48
-
49
-
50
-
51
-
52
-
53
-
54
-
55
-
56
-
57
-
58
-
59
-
60
-
61
-
62
-
63
-
64
-
65
-
66
-
67
-
68
-
69
-
70
-
71
-
72
-
73
-
74
-
75
-
76
-
77
-
78
-
79
-
80
-
81
-
82
-
83
-
84
-
85
-
86
-
87
-
88
-
89
-
90
-
91
-
92
-
93
-
94
-
95
-
96
-
97
-
98
-
99
-
100
-
101
-
102
-
103
-
104
-
105
-
106
-
107
-
108
-
109
-
110
-
111
-
112
-
113
-
114
-
115
-
116
-
117
-
118
-
119
-
120
-
121
-
122
-
123
-
124
-
125
-
126
-
127
-
128
-
129
-
130
-
131
-
132
-
133
-
134
-
135
-
136
-
137
-
138
-
139
-
140
-
141
-
142
-
143
-
144
-
145
-
146
-
 147
147 -
 148
148 -
 149
149 -
 150
150 -
 151
151 -
 152
152 -
 153
153 -
 154
154 -
 155
155 -
 156
156 -
 157
157 -
 158
158 -
 159
159 -
 160
160 -
 161
161 -
 162
162 -
 163
163 -
 164
164 -
 165
165 -
 166
166 -
 167
167 -
168
-
169
-
170
-
171
-
172
-
173
-
174
-
175
-
176
-
177
-
178
-
179
-
180
-
181
-
182
-
183
-
184
-
185
-
186
-
187
-
188
-
189
-
190
-
191
-
192
-
193
-
194
-
195
-
196
-
197
-
198
-
199
-
200
-
201
-
202
-
203
-
204
-
205
-
206
-
207
-
208
-
209
-
210
-
211
-
212
-
213
-
214
-
215
-
216
-
217
-
218
-
219
-
220
-
221
-
222
-
223
-
224
-
225
-
226
-
227
-
228
-
229
-
230
-
231
-
232
-
233
-
234
-
235
-
236
-
237
-
238
-
239
-
240
-
241
-
242
-
243
-
244
-
245
-
246
-
247
-
248
-
249
-
250
-
251
-
252
-
253
-
254
-
255
-
256
-
257
-
258
-
259
-
260
-
261
-
262
-
263
-
264
-
265
-
266
-
267
-
268
-
269
-
270
-
271
-
272
-
273
-
274
-
275
-
276
-
277
-
278
-
279
-
280
 |
 |

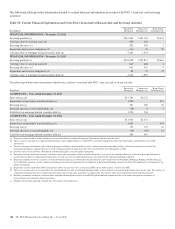
See Note 10 Goodwill and Other Intangible Assets for further
discussion of the accounting for goodwill and other intangible
assets.
The estimated amount of RBC Bank (USA) revenue and net
income (excluding integration costs) included in PNC’s
consolidated income statement for 2012 was $1.0 billion and
$273 million, respectively. Upon closing and conversion of
the RBC Bank (USA) transaction, subsequent to March 2,
2012, separate records for RBC Bank (USA) as a stand-alone
business have not been maintained as the operations of RBC
Bank (USA) have been fully integrated into PNC. RBC Bank
(USA) revenue and earnings disclosed above reflect
management’s best estimate, based on information available at
the reporting date.
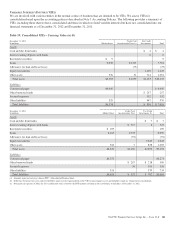
The following table presents certain unaudited pro forma
information for illustrative purposes only, for 2012 and 2011
as if RBC Bank (USA) had been acquired on January 1, 2011.
The unaudited estimated pro forma information combines the
historical results of RBC Bank (USA) with the Company’s
consolidated historical results and includes certain
adjustments reflecting the estimated impact of certain fair
value adjustments for the respective periods. The pro forma
information is not indicative of what would have occurred had
the acquisition taken place on January 1, 2011. In particular,
no adjustments have been made to eliminate the impact of
other-than-temporary impairment losses and losses recognized
on the sale of securities that may not have been necessary had
the investment securities been recorded at fair value as of
January 1, 2011. The unaudited pro forma information does
not consider any changes to the provision for credit losses
resulting from recording loan assets at fair value.
Additionally, the pro forma financial information does not
include the impact of possible business model changes and
does not reflect pro forma adjustments to conform accounting
policies between RBC Bank (USA) and PNC. Additionally,
PNC expects to achieve further operating cost savings and
other business synergies, including revenue growth, as a result
of the acquisition that are not reflected in the pro forma
amounts that follow. As a result, actual results will differ from
the unaudited pro forma information presented.
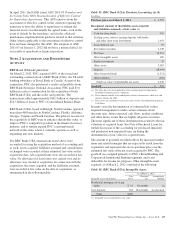
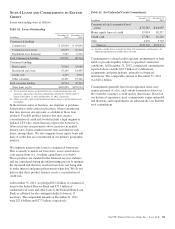
Table 57: RBC Bank (USA) and PNC Unaudited Pro Forma
Results
For the Year Ended December 31
In millions 2012 2011
Total revenues $15,721 $15,421
Net income 2,989 2,911
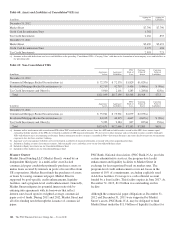
In connection with the RBC Bank (USA) acquisition and other
prior acquisitions, PNC recognized $267 million of integration
charges in 2012. PNC recognized $42 million of integration
charges in 2011 in connection with prior acquisitions. The
integration charges are included in the table above.
S
ALE OF
S
MARTSTREET
Effective October 26, 2012, PNC divested certain deposits and
assets of the Smartstreet business unit, which was acquired by
PNC as part of the RBC Bank (USA) acquisition, to Union
Bank, N.A. Smartstreet is a nationwide business focused on
homeowner or community association managers and had
approximately $1 billion of assets and deposits as of
September 30, 2012. The gain on sale was immaterial and
resulted in a reduction of goodwill and core deposit
intangibles of $46 million and $13 million, respectively.
Results from operations of Smartstreet from March 2, 2012
through October 26, 2012 are included in our Consolidated
Income Statement.
F
LAGSTAR
B
RANCH
A
CQUISITION
Effective December 9, 2011, PNC acquired 27 branches in the
northern metropolitan Atlanta, Georgia area from Flagstar
Bank, FSB, a subsidiary of Flagstar Bancorp, Inc. The fair
value of the assets acquired totaled approximately $211.8
million, including $169.3 million in cash, $24.3 million in
fixed assets and $18.2 million of goodwill and intangible
assets. We also assumed approximately $210.5 million of
deposits associated with these branches. No deposit premium
was paid and no loans were acquired in the transaction. Our
Consolidated Income Statement includes the impact of the
branch activity subsequent to our December 9, 2011
acquisition.
B
ANK
A
TLANTIC
B
RANCH
A
CQUISITION
Effective June 6, 2011, we acquired 19 branches in the greater
Tampa, Florida area from BankAtlantic, a subsidiary of
BankAtlantic Bancorp, Inc. The fair value of the assets
acquired totaled $324.9 million, including $256.9 million in
cash, $26.0 million in fixed assets and $42.0 million of
goodwill and intangible assets. We also assumed
approximately $324.5 million of deposits associated with
these branches. A $39.0 million deposit premium was paid
and no loans were acquired in the transaction. Our
Consolidated Income Statement includes the impact of the
branch activity subsequent to our June 6, 2011 acquisition.
S
ALE OF
PNC G
LOBAL
I
NVESTMENT
S
ERVICING
On July 1, 2010, we sold PNC Global Investment Servicing
Inc. (GIS), a leading provider of processing, technology and
business intelligence services to asset managers, broker-
dealers and financial advisors worldwide, for $2.3 billion in
cash pursuant to a definitive agreement entered into on
February 2, 2010. This transaction resulted in a pretax gain of
$639 million, net of transaction costs, in the third quarter of
2010. This gain and results of operations of GIS through
June 30, 2010 are presented as Income from discontinued
operations, net of income taxes, on our Consolidated Income
Statement. As part of the sale agreement, PNC has agreed to
provide certain transitional services on behalf of GIS until
completion of related systems conversion activities.
138 The PNC Financial Services Group, Inc. – Form 10-K