PNC Bank 2012 Annual Report Download - page 173
Download and view the complete annual report
Please find page 173 of the 2012 PNC Bank annual report below. You can navigate through the pages in the report by either clicking on the pages listed below, or by using the keyword search tool below to find specific information within the annual report.-
 1
1 -
2
-
3
-
4
-
5
-
6
-
7
-
8
-
9
-
10
-
11
-
12
-
13
-
14
-
15
-
16
-
17
-
18
-
19
-
20
-
21
-
22
-
23
-
24
-
25
-
26
-
27
-
28
-
29
-
30
-
31
-
32
-
33
-
34
-
35
-
36
-
37
-
38
-
39
-
40
-
41
-
42
-
43
-
44
-
45
-
46
-
47
-
48
-
49
-
50
-
51
-
52
-
53
-
54
-
55
-
56
-
57
-
58
-
59
-
60
-
61
-
62
-
63
-
64
-
65
-
66
-
67
-
68
-
69
-
70
-
71
-
72
-
73
-
74
-
75
-
76
-
77
-
78
-
79
-
80
-
81
-
82
-
83
-
84
-
85
-
86
-
87
-
88
-
89
-
90
-
91
-
92
-
93
-
94
-
95
-
96
-
97
-
98
-
99
-
100
-
101
-
102
-
103
-
104
-
105
-
106
-
107
-
108
-
109
-
110
-
111
-
112
-
113
-
114
-
115
-
116
-
117
-
118
-
119
-
120
-
121
-
122
-
123
-
124
-
125
-
126
-
127
-
128
-
129
-
130
-
131
-
132
-
133
-
134
-
135
-
136
-
137
-
138
-
139
-
140
-
141
-
142
-
143
-
144
-
145
-
146
-
147
-
148
-
149
-
150
-
151
-
152
-
153
-
154
-
155
-
156
-
157
-
158
-
159
-
160
-
161
-
162
-
 163
163 -
 164
164 -
 165
165 -
 166
166 -
 167
167 -
 168
168 -
 169
169 -
 170
170 -
 171
171 -
 172
172 -
 173
173 -
 174
174 -
 175
175 -
 176
176 -
 177
177 -
 178
178 -
 179
179 -
 180
180 -
 181
181 -
 182
182 -
 183
183 -
184
-
185
-
186
-
187
-
188
-
189
-
190
-
191
-
192
-
193
-
194
-
195
-
196
-
197
-
198
-
199
-
200
-
201
-
202
-
203
-
204
-
205
-
206
-
207
-
208
-
209
-
210
-
211
-
212
-
213
-
214
-
215
-
216
-
217
-
218
-
219
-
220
-
221
-
222
-
223
-
224
-
225
-
226
-
227
-
228
-
229
-
230
-
231
-
232
-
233
-
234
-
235
-
236
-
237
-
238
-
239
-
240
-
241
-
242
-
243
-
244
-
245
-
246
-
247
-
248
-
249
-
250
-
251
-
252
-
253
-
254
-
255
-
256
-
257
-
258
-
259
-
260
-
261
-
262
-
263
-
264
-
265
-
266
-
267
-
268
-
269
-
270
-
271
-
272
-
273
-
274
-
275
-
276
-
277
-
278
-
279
-
280
 |
 |

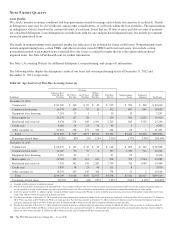
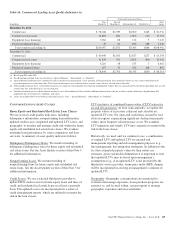
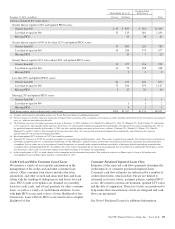
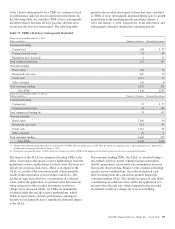
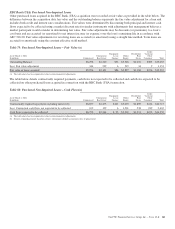
Table 70: Credit Card and Other Consumer Loan Classes Asset Quality Indicators
Credit Card (a) Other Consumer (b)
Dollars in millions Amount
% of Total Loans
Using FICO
Credit Metric Amount
% of Total Loans
Using FICO
Credit Metric
December 31, 2012
FICO score greater than 719 $2,247 52% $ 7,006 60%
650 to 719 1,169 27 2,896 25
620 to 649 188 5 459 4
Less than 620 271 6 602 5
No FICO score available or required (c) 428 10 741 6
Total loans using FICO credit metric 4,303 100% 11,704 100%
Consumer loans using other internal credit metrics (b) 9,747
Total loan balance $4,303 $21,451
Weighted-average updated FICO score (d) 726 739
December 31, 2011
FICO score greater than 719 $2,016 51% $ 5,556 61%
650 to 719 1,100 28 2,125 23
620 to 649 184 5 370 4
Less than 620 284 7 548 6
No FICO score available or required (c) 392 9 574 6
Total loans using FICO credit metric 3,976 100% 9,173 100%
Consumer loans using other internal credit metrics (b) 9,993
Total loan balance $3,976 $19,166
Weighted-average updated FICO score (d) 723 739
(a) At December 31, 2012, we had $36 million of credit card loans that are higher risk (i.e., loans with both updated FICO scores less than 660 and in late stage (90+ days) delinquency
status). The majority of the December 31, 2012 balance related to higher risk credit card loans is geographically distributed throughout the following areas: Ohio 18%, Pennsylvania
14%, Michigan 12%, Illinois 8%, Indiana 6%, Florida 6%, New Jersey 5%, Kentucky 4%, and North Carolina 4%. All other states, none of which comprise more than 3%, make up
the remainder of the balance. At December 31, 2011, we had $49 million of credit card loans that are higher risk. The majority of the December 31, 2011 balance related to higher risk
credit card loans is geographically distributed throughout the following areas: Ohio 20%, Michigan 14%, Pennsylvania 13%, Illinois 7%, Indiana 7%, Florida 6% and Kentucky 5%.
All other states, none of which comprise more than 4%, make up the remainder of the balance.
(b) Other consumer loans for which updated FICO scores are used as an asset quality indicator include nongovernment guaranteed or insured education loans, automobile loans and other
secured and unsecured lines and loans. Other consumer loans (or leases) for which other internal credit metrics are used as an asset quality indicator include primarily government
guaranteed or insured education loans, as well as consumer loans to high net worth individuals and pools of auto loans (and leases) financed for PNC clients via securitization
facilities. Other internal credit metrics may include delinquency status, geography, loan to value, asset concentrations, loss coverage multiples, net loss rates or other factors as well as
servicer quality reviews associated with the securitizations or other factors.
(c) Credit card loans and other consumer loans with no FICO score available or required refers to new accounts issued to borrowers with limited credit history, accounts for which we
cannot obtain an updated FICO (e.g., recent profile changes), cards issued with a business name, and/or cards secured by collateral. Management proactively assesses the risk and size
of this loan portfolio and, when necessary, takes actions to mitigate the credit risk.
(d) Weighted-average updated FICO score excludes accounts with no FICO score available or required.
154 The PNC Financial Services Group, Inc. – Form 10-K