PNC Bank 2012 Annual Report Download - page 82
Download and view the complete annual report
Please find page 82 of the 2012 PNC Bank annual report below. You can navigate through the pages in the report by either clicking on the pages listed below, or by using the keyword search tool below to find specific information within the annual report.-
 1
1 -
2
-
3
-
4
-
5
-
6
-
7
-
8
-
9
-
10
-
11
-
12
-
13
-
14
-
15
-
16
-
17
-
18
-
19
-
20
-
21
-
22
-
23
-
24
-
25
-
26
-
27
-
28
-
29
-
30
-
31
-
32
-
33
-
34
-
35
-
36
-
37
-
38
-
39
-
40
-
41
-
42
-
43
-
44
-
45
-
46
-
47
-
48
-
49
-
50
-
51
-
52
-
53
-
54
-
55
-
56
-
57
-
58
-
59
-
60
-
61
-
62
-
63
-
64
-
65
-
66
-
67
-
68
-
69
-
70
-
71
-
 72
72 -
 73
73 -
 74
74 -
 75
75 -
 76
76 -
 77
77 -
 78
78 -
 79
79 -
 80
80 -
 81
81 -
 82
82 -
 83
83 -
 84
84 -
 85
85 -
 86
86 -
 87
87 -
 88
88 -
 89
89 -
 90
90 -
 91
91 -
 92
92 -
93
-
94
-
95
-
96
-
97
-
98
-
99
-
100
-
101
-
102
-
103
-
104
-
105
-
106
-
107
-
108
-
109
-
110
-
111
-
112
-
113
-
114
-
115
-
116
-
117
-
118
-
119
-
120
-
121
-
122
-
123
-
124
-
125
-
126
-
127
-
128
-
129
-
130
-
131
-
132
-
133
-
134
-
135
-
136
-
137
-
138
-
139
-
140
-
141
-
142
-
143
-
144
-
145
-
146
-
147
-
148
-
149
-
150
-
151
-
152
-
153
-
154
-
155
-
156
-
157
-
158
-
159
-
160
-
161
-
162
-
163
-
164
-
165
-
166
-
167
-
168
-
169
-
170
-
171
-
172
-
173
-
174
-
175
-
176
-
177
-
178
-
179
-
180
-
181
-
182
-
183
-
184
-
185
-
186
-
187
-
188
-
189
-
190
-
191
-
192
-
193
-
194
-
195
-
196
-
197
-
198
-
199
-
200
-
201
-
202
-
203
-
204
-
205
-
206
-
207
-
208
-
209
-
210
-
211
-
212
-
213
-
214
-
215
-
216
-
217
-
218
-
219
-
220
-
221
-
222
-
223
-
224
-
225
-
226
-
227
-
228
-
229
-
230
-
231
-
232
-
233
-
234
-
235
-
236
-
237
-
238
-
239
-
240
-
241
-
242
-
243
-
244
-
245
-
246
-
247
-
248
-
249
-
250
-
251
-
252
-
253
-
254
-
255
-
256
-
257
-
258
-
259
-
260
-
261
-
262
-
263
-
264
-
265
-
266
-
267
-
268
-
269
-
270
-
271
-
272
-
273
-
274
-
275
-
276
-
277
-
278
-
279
-
280
 |
 |
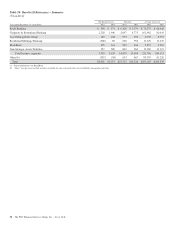
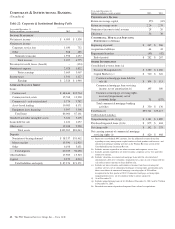
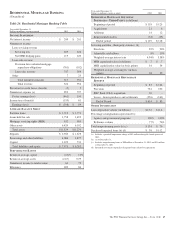
Corporate & Institutional Banking earned $2.3 billion in 2012,
compared with $1.9 billion in 2011. The increase in earnings
was primarily due to higher revenue partially offset by higher
noninterest expense and a provision for credit losses of zero in
2012 compared with a benefit of $124 million in 2011. We
continued to focus on building client relationships including
increasing cross sales and adding new clients where the risk-
return profile was attractive.
Results in 2012 include the impact of the RBC Bank (USA)
acquisition in March 2012, which added approximately $7.5
billion of loans and $4.8 billion of deposits at acquisition date.
Highlights of Corporate & Institutional Banking’s
performance throughout 2012 include the following:
• Corporate & Institutional Banking continued to
execute on strategic initiatives, including in the
Southeast, by organically growing and deepening
client relationships that meet our risk/return
measures. Approximately 1,100 new primary
Corporate Banking clients were added in 2012.
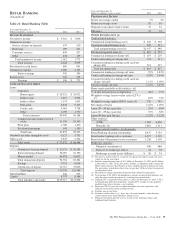
• Loan commitments increased 24% to $181 billion at
December 31, 2012 compared to December 31, 2011,
primarily due to the RBC Bank (USA) acquisition
and growth in our Corporate Banking (Corporate
Finance, Financial Services Advisory and Banking,
Public Finance and Healthcare businesses), Real
Estate and Business Credit (asset-based lending)
businesses.
• Period-end loan balances have increased for the ninth
consecutive quarter, including an increase of 4% at
December 31, 2012 compared with September 30,
2012 and 22% compared with December 31, 2011.
• Our Treasury Management business, which ranks
among the top providers in the country, continued to
invest in markets, products and infrastructure as well
as major initiatives such as healthcare.
• Cross sales of treasury management and capital
markets-related products and services to customers in
PNC’s markets continued to be successful and were
ahead of 2011.
• Midland Loan Services was the number one servicer
of Fannie Mae and Freddie Mac multifamily and
healthcare loans and was the second leading servicer
of commercial and multifamily loans by volume as of
June 30, 2012 according to Mortgage Bankers
Association. Midland is the only U.S. commercial
mortgage servicer to receive the highest primary,
master and special servicer ratings from Fitch
Ratings, Standard & Poor’s and Morningstar.
Net interest income in 2012 was $4.1 billion, a 16% increase
from 2011, reflecting higher average loans and deposits,
partially offset by lower spreads on loans and deposits.
Corporate service fees were $1.0 billion in 2012, an increase
of $278 million from 2011, primarily due to higher
commercial mortgage servicing revenue and merger and
acquisition advisory fees. The major components of corporate
service fees are treasury management, corporate finance fees
and commercial mortgage servicing revenue.
Other noninterest income was $568 million in 2012 compared
with $485 million in 2011. The increase of $83 million was
primarily due to gains on asset sales and the impact of
customer driven capital markets activity.
The provision for credit losses was zero in 2012 compared
with a benefit of $124 million in 2011. The increase reflects
higher loan and commitment levels offset by positive credit
migration. Despite the increase, the overall credit quality
remains strong. Net charge-offs were $142 million in 2012,
which decreased $233 million, or 62%, compared with 2011.
The decline was attributable primarily to the commercial real
estate portfolio.
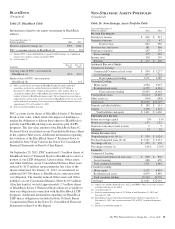
Nonperforming assets declined for the eleventh consecutive
quarter, and at $1.2 billion, represented a 37% decrease from
December 31, 2011.
Noninterest expense was $2.0 billion in 2012, an increase of
$196 million from 2011. Higher compensation-related costs
were driven by improved performance and higher staffing,
including the impact of the RBC Bank (USA) acquisition.
Average loans were $86.1 billion in 2012 compared with
$67.2 billion in 2011, an increase of 28%. Organically,
average loans grew 20% in the comparison.
• The Corporate Banking business provides lending,
treasury management, and capital markets-related
products and services to mid-sized corporations,
government and not-for-profit entities, and
selectively to large corporations. Average loans for
this business increased $11.0 billion, or 33%, in 2012
compared with 2011, primarily due to an increase in
loan commitments from new customers. Organically,
average loans for this business grew 22% in the
comparison.
• PNC Real Estate provides commercial real estate and
real estate-related lending and is one of the industry’s
top providers of both conventional and affordable
multifamily financing. Average loans for this
business increased $2.7 billion, or 17%, in 2012
compared with 2011 due to increased originations.
• PNC Business Credit is one of the top five asset-
based lenders in the country with increasing market
share according to the Commercial Finance
Association. The loan portfolio is relatively high
yielding, with moderate risk as the loans are mainly
secured by short-term assets. Average loans
increased $1.9 billion, or 23%, in 2012 compared
with 2011 due to customers seeking stable lending
sources, loan usage rates, and market share
expansion.
The PNC Financial Services Group, Inc. – Form 10-K 63