PNC Bank 2012 Annual Report Download - page 202
Download and view the complete annual report
Please find page 202 of the 2012 PNC Bank annual report below. You can navigate through the pages in the report by either clicking on the pages listed below, or by using the keyword search tool below to find specific information within the annual report.-
 1
1 -
2
-
3
-
4
-
5
-
6
-
7
-
8
-
9
-
10
-
11
-
12
-
13
-
14
-
15
-
16
-
17
-
18
-
19
-
20
-
21
-
22
-
23
-
24
-
25
-
26
-
27
-
28
-
29
-
30
-
31
-
32
-
33
-
34
-
35
-
36
-
37
-
38
-
39
-
40
-
41
-
42
-
43
-
44
-
45
-
46
-
47
-
48
-
49
-
50
-
51
-
52
-
53
-
54
-
55
-
56
-
57
-
58
-
59
-
60
-
61
-
62
-
63
-
64
-
65
-
66
-
67
-
68
-
69
-
70
-
71
-
72
-
73
-
74
-
75
-
76
-
77
-
78
-
79
-
80
-
81
-
82
-
83
-
84
-
85
-
86
-
87
-
88
-
89
-
90
-
91
-
92
-
93
-
94
-
95
-
96
-
97
-
98
-
99
-
100
-
101
-
102
-
103
-
104
-
105
-
106
-
107
-
108
-
109
-
110
-
111
-
112
-
113
-
114
-
115
-
116
-
117
-
118
-
119
-
120
-
121
-
122
-
123
-
124
-
125
-
126
-
127
-
128
-
129
-
130
-
131
-
132
-
133
-
134
-
135
-
136
-
137
-
138
-
139
-
140
-
141
-
142
-
143
-
144
-
145
-
146
-
147
-
148
-
149
-
150
-
151
-
152
-
153
-
154
-
155
-
156
-
157
-
158
-
159
-
160
-
161
-
162
-
163
-
164
-
165
-
166
-
167
-
168
-
169
-
170
-
171
-
172
-
173
-
174
-
175
-
176
-
177
-
178
-
179
-
180
-
181
-
182
-
183
-
184
-
185
-
186
-
187
-
188
-
189
-
190
-
191
-
 192
192 -
 193
193 -
 194
194 -
 195
195 -
 196
196 -
 197
197 -
 198
198 -
 199
199 -
 200
200 -
 201
201 -
 202
202 -
 203
203 -
 204
204 -
 205
205 -
 206
206 -
 207
207 -
 208
208 -
 209
209 -
 210
210 -
 211
211 -
 212
212 -
213
-
214
-
215
-
216
-
217
-
218
-
219
-
220
-
221
-
222
-
223
-
224
-
225
-
226
-
227
-
228
-
229
-
230
-
231
-
232
-
233
-
234
-
235
-
236
-
237
-
238
-
239
-
240
-
241
-
242
-
243
-
244
-
245
-
246
-
247
-
248
-
249
-
250
-
251
-
252
-
253
-
254
-
255
-
256
-
257
-
258
-
259
-
260
-
261
-
262
-
263
-
264
-
265
-
266
-
267
-
268
-
269
-
270
-
271
-
272
-
273
-
274
-
275
-
276
-
277
-
278
-
279
-
280
 |
 |

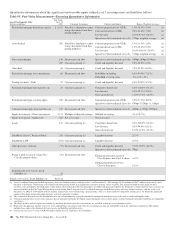
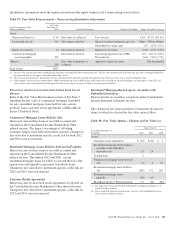
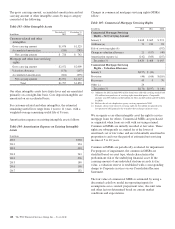
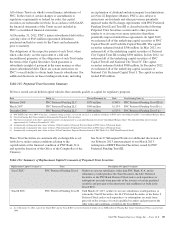
Quantitative information about the significant unobservable inputs within Level 3 nonrecurring assets follows.
Table 97: Fair Value Measurements – Nonrecurring Quantitative Information
Level 3 Instruments Only
Dollars in millions
Fair Value
December 31,
2012 Valuation Techniques Unobservable Inputs Range (Weighted Average)
Assets
Nonaccrual loans (a) $ 90 Fair value of collateral Loss severity 4.6% - 97.2% (58.1%)
Loans held for sale 315 Discounted cash flow Spread over the benchmark curve (b) 40bps - 233bps (86bps)
Embedded servicing value .8% - 2.6% (2.0%)
Equity investments 12 Discounted cash flow Market rate of return 4.6% - 6.5% (5.4%)
Commercial mortgage
servicing rights 191
Discounted cash flow Constant prepayment rate (CPR)
Discount rate
7.1% - 20.1% (7.8%)
5.6% - 7.8% (7.7%)
Other (c)
299
Fair value of property or
collateral
Appraised value/sales price Not meaningful
Total Assets $907
(a) The fair value of nonaccrual loans included in this line item is determined based on internal loss rates. The fair value of nonaccrual loans where the fair value is determined based on
the appraised value or sales price is included within Other, below.
(b) The assumed yield spread over benchmark curve for each instrument is generally intended to incorporate non-interest-rate risks such as credit and liquidity risks.
(c) Other includes nonaccrual loans of $68 million, OREO and foreclosed assets of $207 million and Long-lived assets held for sale of $24 million as of December 31, 2012. The fair
value of these assets is determined based on appraised value or sales price, the range of which is not meaningful to disclose.
F
INANCIAL
A
SSETS
A
CCOUNTED
F
OR
U
NDER
F
AIR
V
ALUE
O
PTION
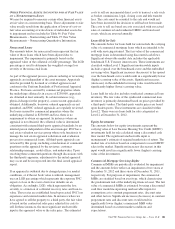
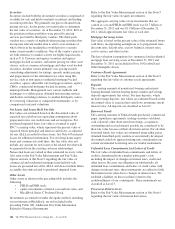
Refer to the Fair Value Measurement section of this Note 9
regarding the fair value of commercial mortgage loans held
for sale, residential mortgage loans held for sale, certain
portfolio loans, customer resale agreements, and BlackRock
Series C Preferred Stock.
Commercial Mortgage Loans Held for Sale
Interest income on these loans is recorded as earned and
reported on the Consolidated Income Statement in Other
interest income. The impact on earnings of offsetting
economic hedges is not reflected in these amounts. Changes in
fair value due to instrument-specific credit risk for both 2012
and 2011 were not material.
Residential Mortgage Loans Held for Sale and in Portfolio
Interest income on these loans is recorded as earned and
reported on the Consolidated Income Statement in Other
interest income. Throughout 2012 and 2011, certain
residential mortgage loans for which we elected the fair value
option were subsequently reclassified to portfolio loans.
Changes in fair value due to instrument-specific credit risk for
2012 and 2011 were not material.
Customer Resale Agreements
Interest income on structured resale agreements is reported on
the Consolidated Income Statement in Other interest income.
Changes in fair value due to instrument-specific credit risk for
2012 and 2011 were not material.
Residential Mortgage-Backed Agency Securities with
Embedded Derivatives
Interest income on securities is reported on the Consolidated
Income Statement in Interest income.
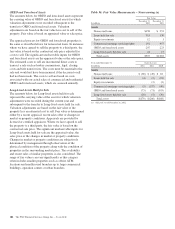
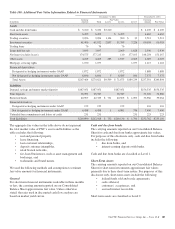
The changes in fair value included in Noninterest income for
items for which we elected the fair value option follow.
Table 98: Fair Value Option – Changes in Fair Value (a)
Gains (Losses)
Year ended December 31
In millions 2012 2011 2010
Assets
Customer resale agreements $ (10) $ (12) $ 1
Residential mortgage-backed agency
securities with embedded
derivatives (b) 13 24
Trading loans 2
Commercial mortgage loans held for
sale (5) 3 16
Residential mortgage loans held for
sale (180) 172 280
Residential mortgage loans –
portfolio (36) (17)
BlackRock Series C Preferred Stock 33 (14) (86)
(a) The impact on earnings of offsetting hedged items or hedging instruments is not
reflected in these amounts.
(b) These residential mortgage-backed agency securities with embedded derivatives
were carried as Trading securities.
The PNC Financial Services Group, Inc. – Form 10-K 183