PNC Bank 2012 Annual Report Download - page 58
Download and view the complete annual report
Please find page 58 of the 2012 PNC Bank annual report below. You can navigate through the pages in the report by either clicking on the pages listed below, or by using the keyword search tool below to find specific information within the annual report.
C
ONSOLIDATED
I
NCOME
S
TATEMENT
R
EVIEW
Our Consolidated Income Statement is presented in Item 8 of
this Report.
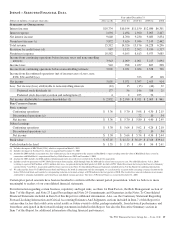
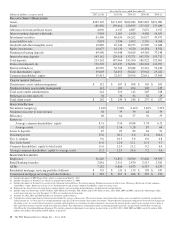
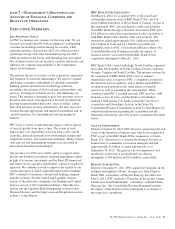
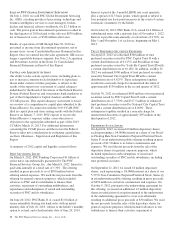
Net income for 2012 was $3.0 billion compared with $3.1
billion for 2011. Revenue growth of 8 percent and a decline in
the provision for credit losses were more than offset by a
16 percent increase in noninterest expense in 2012 compared
to 2011. Further detail is included in the Net Interest Income,
Noninterest Income, Provision For Credit Losses and
Noninterest Expense portions of this Consolidated Income
Statement Review.
N
ET
I
NTEREST
I
NCOME
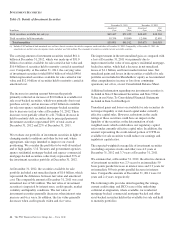
Table 2: Net Interest Income and Net Interest Margin
Year ended December 31
Dollars in millions 2012 2011
Net interest income $9,640 $8,700
Net interest margin 3.94% 3.92%
Changes in net interest income and margin result from the
interaction of the volume and composition of interest-earning
assets and related yields, interest-bearing liabilities and related
rates paid, and noninterest-bearing sources of funding. See the
Statistical Information (Unaudited) – Average Consolidated
Balance Sheet And Net Interest Analysis and Analysis Of
Year-To-Year Changes In Net Interest Income in Item 8 of
this Report and the discussion of purchase accounting
accretion of purchased impaired loans in the Consolidated
Balance Sheet Review in this Item 7 for additional
information.
The increase in net interest income in 2012 compared with
2011 was primarily due to the impact of the RBC Bank (USA)
acquisition, organic loan growth and lower funding costs.
Purchase accounting accretion remained stable at $1.1 billion
in both periods.
The net interest margin was 3.94% for 2012 and 3.92% for
2011. The increase in the comparison was primarily due to a
decrease in the weighted-average rate accrued on total interest-
bearing liabilities of 29 basis points, largely offset by a 21 basis
point decrease on the yield on total interest-earning assets. The
decrease in the rate on interest-bearing liabilities was primarily
due to the runoff of maturing retail certificates of deposit and
the redemption of additional trust preferred and hybrid capital
securities during 2012, in addition to an increase in FHLB
borrowings and commercial paper as lower-cost funding
sources. The decrease in the yield on interest-earning assets was
primarily due to lower rates on new loan volume and lower
yields on new securities in the current low rate environment.
With respect to the first quarter of 2013, we expect net interest
income to decline by two to three percent compared to fourth
quarter 2012 net interest income of $2.4 billion, due to a
decrease in purchase accounting accretion of up to $50 to
$60 million, including lower expected cash recoveries.
For the full year 2013, we expect net interest income to
decrease compared with 2012, assuming an expected decline
in purchase accounting accretion of approximately $400
million, while core net interest income is expected to increase
in the year-over-year comparison. We believe our net interest
margin will come under pressure in 2013, due to the expected
decline in purchase accounting accretion and assuming that
the current low rate environment continues.
N
ONINTEREST
I
NCOME
Noninterest income totaled $5.9 billion for 2012 and $5.6
billion for 2011. The overall increase in the comparison was
primarily due to an increase in residential mortgage loan sales
revenue driven by higher loan origination volume, gains on
sales of Visa Class B common shares and higher corporate
service fees, largely offset by higher provision for residential
mortgage repurchase obligations.
Asset management revenue, including BlackRock, totaled
$1.2 billion in 2012 compared with $1.1 billion in 2011. This
increase was primarily due to higher earnings from our
BlackRock investment. Discretionary assets under
management increased to $112 billion at December 31, 2012
compared with $107 billion at December 31, 2011 driven by
stronger average equity markets, positive net flows and strong
sales performance.
For 2012, consumer services fees were $1.1 billion compared
with $1.2 billion in 2011. The decline reflected the regulatory
impact of lower interchange fees on debit card transactions
partially offset by customer growth. As further discussed in
the Retail Banking portion of the Business Segments Review
section of this Item 7, the Dodd-Frank limits on interchange
rates were effective October 1, 2011 and had a negative
impact on revenue of approximately $314 million in 2012 and
$75 million in 2011. This impact was partially offset by higher
volumes of merchant, customer credit card and debit card
transactions and the impact of the RBC Bank (USA)
acquisition.
Corporate services revenue increased by $.3 billion, or 30
percent, to $1.2 billion in 2012 compared with $.9 billion in
2011 due to higher commercial mortgage servicing revenue
and higher merger and acquisition advisory fees in 2012. The
major components of corporate services revenue are treasury
management revenue, corporate finance fees, including
revenue from capital markets-related products and services,
and commercial mortgage servicing revenue, including
commercial mortgage banking activities. See the Product
Revenue portion of this Consolidated Income Statement
Review for further detail.
The PNC Financial Services Group, Inc. – Form 10-K 39


