PNC Bank 2012 Annual Report Download - page 201
Download and view the complete annual report
Please find page 201 of the 2012 PNC Bank annual report below. You can navigate through the pages in the report by either clicking on the pages listed below, or by using the keyword search tool below to find specific information within the annual report.-
 1
1 -
2
-
3
-
4
-
5
-
6
-
7
-
8
-
9
-
10
-
11
-
12
-
13
-
14
-
15
-
16
-
17
-
18
-
19
-
20
-
21
-
22
-
23
-
24
-
25
-
26
-
27
-
28
-
29
-
30
-
31
-
32
-
33
-
34
-
35
-
36
-
37
-
38
-
39
-
40
-
41
-
42
-
43
-
44
-
45
-
46
-
47
-
48
-
49
-
50
-
51
-
52
-
53
-
54
-
55
-
56
-
57
-
58
-
59
-
60
-
61
-
62
-
63
-
64
-
65
-
66
-
67
-
68
-
69
-
70
-
71
-
72
-
73
-
74
-
75
-
76
-
77
-
78
-
79
-
80
-
81
-
82
-
83
-
84
-
85
-
86
-
87
-
88
-
89
-
90
-
91
-
92
-
93
-
94
-
95
-
96
-
97
-
98
-
99
-
100
-
101
-
102
-
103
-
104
-
105
-
106
-
107
-
108
-
109
-
110
-
111
-
112
-
113
-
114
-
115
-
116
-
117
-
118
-
119
-
120
-
121
-
122
-
123
-
124
-
125
-
126
-
127
-
128
-
129
-
130
-
131
-
132
-
133
-
134
-
135
-
136
-
137
-
138
-
139
-
140
-
141
-
142
-
143
-
144
-
145
-
146
-
147
-
148
-
149
-
150
-
151
-
152
-
153
-
154
-
155
-
156
-
157
-
158
-
159
-
160
-
161
-
162
-
163
-
164
-
165
-
166
-
167
-
168
-
169
-
170
-
171
-
172
-
173
-
174
-
175
-
176
-
177
-
178
-
179
-
180
-
181
-
182
-
183
-
184
-
185
-
186
-
187
-
188
-
189
-
190
-
 191
191 -
 192
192 -
 193
193 -
 194
194 -
 195
195 -
 196
196 -
 197
197 -
 198
198 -
 199
199 -
 200
200 -
 201
201 -
 202
202 -
 203
203 -
 204
204 -
 205
205 -
 206
206 -
 207
207 -
 208
208 -
 209
209 -
 210
210 -
 211
211 -
212
-
213
-
214
-
215
-
216
-
217
-
218
-
219
-
220
-
221
-
222
-
223
-
224
-
225
-
226
-
227
-
228
-
229
-
230
-
231
-
232
-
233
-
234
-
235
-
236
-
237
-
238
-
239
-
240
-
241
-
242
-
243
-
244
-
245
-
246
-
247
-
248
-
249
-
250
-
251
-
252
-
253
-
254
-
255
-
256
-
257
-
258
-
259
-
260
-
261
-
262
-
263
-
264
-
265
-
266
-
267
-
268
-
269
-
270
-
271
-
272
-
273
-
274
-
275
-
276
-
277
-
278
-
279
-
280
 |
 |
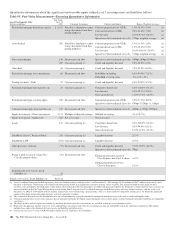
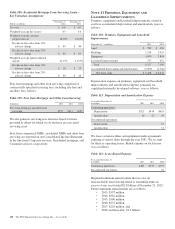
OREO and Foreclosed Assets
The amounts below for OREO and foreclosed assets represent
the carrying value of OREO and foreclosed assets for which
valuation adjustments were recorded subsequent to the
transfer to OREO and foreclosed assets. Valuation
adjustments are based on the fair value less cost to sell of the
property. Fair value is based on appraised value or sales price.
The appraisal process for OREO and foreclosed properties is
the same as described above for nonaccrual loans. In instances
where we have agreed to sell the property to a third party, the
fair value is based on the contractual sale price adjusted for
costs to sell. The significant unobservable inputs for OREO
and foreclosed assets are the appraised value or the sales price.
The estimated costs to sell are incremental direct costs to
transact a sale such as broker commissions, legal, closing
costs and title transfer fees. The costs must be essential to the
sale and would not have been incurred if the decision to sell
had not been made. The costs to sell are based on costs
associated with our actual sales of commercial and residential
OREO and foreclosed assets, which are assessed annually.
Long-Lived Assets Held for Sale
The amounts below for Long-lived assets held for sale
represent the carrying value of the asset for which valuation
adjustments were recorded during the current year and
subsequent to the transfer to Long-lived assets held for sale.
Valuation adjustments are based on the fair value of the
property less an estimated cost to sell. Fair value is determined
either by a recent appraisal, recent sales offer or changes in
market or property conditions. Appraisals are provided by
licensed or certified appraisers. Where we have agreed to sell
the property to a third party, the fair value is based on the
contractual sale price. The significant unobservable inputs for
Long-lived assets held for sale are the appraised value, the
sales price or the changes in market or property conditions.
Changes in market or property conditions are subjectively
determined by management through observation of the
physical condition of the property along with the condition of
properties in the surrounding market place. The availability
and recent sales of similar properties is also considered. The
range of fair values can vary significantly as this category
often includes smaller properties such as offsite ATM
locations and smaller rural branches up to large commercial
buildings, operation centers or urban branches.
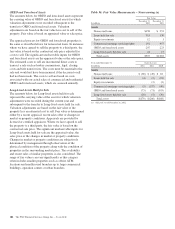
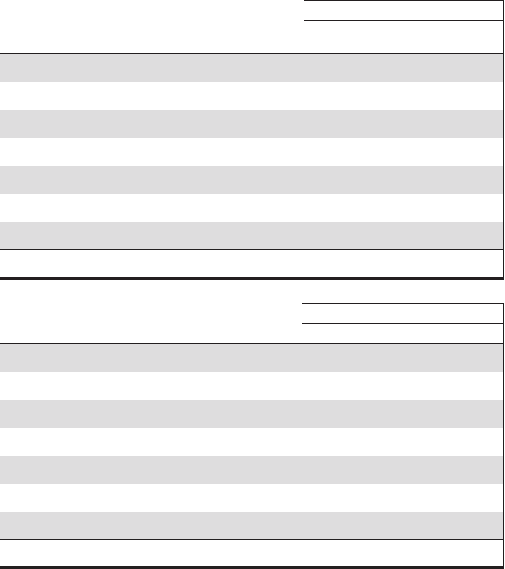
Table 96: Fair Value Measurements – Nonrecurring (a)
Fair Value
In millions
December 31
2012
December 31
2011
Assets
Nonaccrual loans $158 $ 253
Loans held for sale 315 130
Equity investments 12 1
Commercial mortgage servicing rights 191 457
OREO and foreclosed assets 207 223
Long-lived assets held for sale 24 17
Total assets $907 $1,081
Year ended December 31 Gains (Losses)
In millions 2012 2011 2010
Assets
Nonaccrual loans $ (68) $ (49) $ 81
Loans held for sale (4) (2) (93)
Equity investments (2) (3)
Commercial mortgage servicing rights (5) (157) (40)
OREO and foreclosed assets (73) (71) (103)
Long-lived assets held for sale (20) (5) (30)
Total assets $(170) $(286) $(188)
(a) All Level 3 as of December 31, 2012.
182 The PNC Financial Services Group, Inc. – Form 10-K