PNC Bank 2012 Annual Report Download - page 176
Download and view the complete annual report
Please find page 176 of the 2012 PNC Bank annual report below. You can navigate through the pages in the report by either clicking on the pages listed below, or by using the keyword search tool below to find specific information within the annual report.-
 1
1 -
2
-
3
-
4
-
5
-
6
-
7
-
8
-
9
-
10
-
11
-
12
-
13
-
14
-
15
-
16
-
17
-
18
-
19
-
20
-
21
-
22
-
23
-
24
-
25
-
26
-
27
-
28
-
29
-
30
-
31
-
32
-
33
-
34
-
35
-
36
-
37
-
38
-
39
-
40
-
41
-
42
-
43
-
44
-
45
-
46
-
47
-
48
-
49
-
50
-
51
-
52
-
53
-
54
-
55
-
56
-
57
-
58
-
59
-
60
-
61
-
62
-
63
-
64
-
65
-
66
-
67
-
68
-
69
-
70
-
71
-
72
-
73
-
74
-
75
-
76
-
77
-
78
-
79
-
80
-
81
-
82
-
83
-
84
-
85
-
86
-
87
-
88
-
89
-
90
-
91
-
92
-
93
-
94
-
95
-
96
-
97
-
98
-
99
-
100
-
101
-
102
-
103
-
104
-
105
-
106
-
107
-
108
-
109
-
110
-
111
-
112
-
113
-
114
-
115
-
116
-
117
-
118
-
119
-
120
-
121
-
122
-
123
-
124
-
125
-
126
-
127
-
128
-
129
-
130
-
131
-
132
-
133
-
134
-
135
-
136
-
137
-
138
-
139
-
140
-
141
-
142
-
143
-
144
-
145
-
146
-
147
-
148
-
149
-
150
-
151
-
152
-
153
-
154
-
155
-
156
-
157
-
158
-
159
-
160
-
161
-
162
-
163
-
164
-
165
-
 166
166 -
 167
167 -
 168
168 -
 169
169 -
 170
170 -
 171
171 -
 172
172 -
 173
173 -
 174
174 -
 175
175 -
 176
176 -
 177
177 -
 178
178 -
 179
179 -
 180
180 -
 181
181 -
 182
182 -
 183
183 -
 184
184 -
 185
185 -
 186
186 -
187
-
188
-
189
-
190
-
191
-
192
-
193
-
194
-
195
-
196
-
197
-
198
-
199
-
200
-
201
-
202
-
203
-
204
-
205
-
206
-
207
-
208
-
209
-
210
-
211
-
212
-
213
-
214
-
215
-
216
-
217
-
218
-
219
-
220
-
221
-
222
-
223
-
224
-
225
-
226
-
227
-
228
-
229
-
230
-
231
-
232
-
233
-
234
-
235
-
236
-
237
-
238
-
239
-
240
-
241
-
242
-
243
-
244
-
245
-
246
-
247
-
248
-
249
-
250
-
251
-
252
-
253
-
254
-
255
-
256
-
257
-
258
-
259
-
260
-
261
-
262
-
263
-
264
-
265
-
266
-
267
-
268
-
269
-
270
-
271
-
272
-
273
-
274
-
275
-
276
-
277
-
278
-
279
-
280
 |
 |

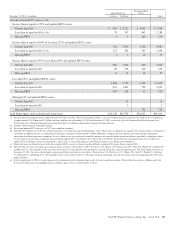
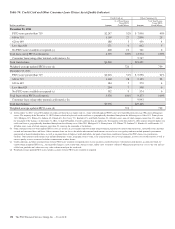
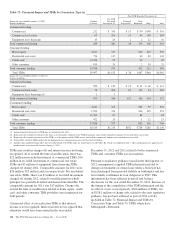
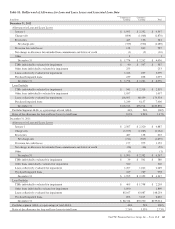
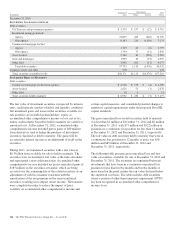
After a loan is determined to be a TDR, we continue to track
its performance under its most recent restructured terms. In
the following table, we consider a TDR to have subsequently
defaulted when it becomes 60 days past due after the most
recent date the loan was restructured. The following table
presents the recorded investment of loans that were classified
as TDRs or were subsequently modified during each 12-month
period prior to the reporting periods preceding January 1,
2012 and January 1, 2011, respectively, in the table below and
subsequently defaulted during these reporting periods.
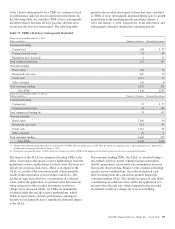
Table 73: TDRs which have Subsequently Defaulted
During the year ended December 31, 2012
Dollars in millions Number of Contracts Recorded Investment
Commercial lending
Commercial 108 $ 57
Commercial real estate 41 68
Equipment lease financing 612
Total commercial lending 155 137
Consumer lending
Home equity 542 50
Residential real estate 482 70
Credit card 4,551 32
Other consumer 118 4
Total consumer lending 5,693 156
Total TDRs 5,848 $293
During the year ended December 31, 2011 (a)
Dollars in millions Number of Contracts Recorded Investment
Commercial lending
Commercial 37 $ 57
Commercial real estate 41 136
Total commercial lending (b) 78 193
Consumer lending
Home equity 1,166 90
Residential real estate 421 93
Credit card 5,012 33
Other consumer 47 1
Total consumer lending 6,646 217
Total TDRs 6,724 $410
(a) Includes loans modified during 2011 that were determined to be TDRs under the requirements of ASU 2011-02, which was adopted on July 1, 2011 and prospectively applied to all
modifications entered into on and after January 1, 2011.
(b) During the year ended December 31, 2011, there were no loans classified as TDRs in the Equipment lease financing loan class that have subsequently defaulted.
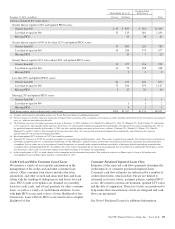
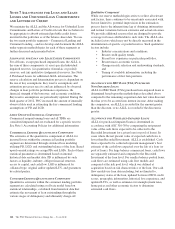
The impact to the ALLL for commercial lending TDRs is the
effect of moving to the specific reserve methodology from the
quantitative reserve methodology for those loans that were not
already put on nonaccrual status. There is an impact to the
ALLL as a result of the concession made, which generally
results in the expectation of fewer future cash flows. The
decline in expected cash flows, consideration of collateral
value, and/or the application of a present value discount rate,
when compared to the recorded investment, results in a
charge-off or increased ALLL. As TDRs are individually
evaluated under the specific reserve methodology, which
builds in expectations of future performance, subsequent
defaults do not generally have a significant additional impact
to the ALLL.
For consumer lending TDRs, the ALLL is calculated using a
discounted cash flow model, which leverages subsequent
default, prepayment, and severity rate assumptions based on
historically observed data. Similar to the commercial lending
specific reserve methodology, the reduced expected cash
flows resulting from the concessions granted impact the
consumer lending ALLL. The decline in expected cash flows,
consideration of collateral value, and/or the application of a
present value discount rate, when compared to the recorded
investment, results in a charge-off or increased ALLL.
The PNC Financial Services Group, Inc. – Form 10-K 157