PNC Bank 2012 Annual Report Download - page 80
Download and view the complete annual report
Please find page 80 of the 2012 PNC Bank annual report below. You can navigate through the pages in the report by either clicking on the pages listed below, or by using the keyword search tool below to find specific information within the annual report.-
 1
1 -
2
-
3
-
4
-
5
-
6
-
7
-
8
-
9
-
10
-
11
-
12
-
13
-
14
-
15
-
16
-
17
-
18
-
19
-
20
-
21
-
22
-
23
-
24
-
25
-
26
-
27
-
28
-
29
-
30
-
31
-
32
-
33
-
34
-
35
-
36
-
37
-
38
-
39
-
40
-
41
-
42
-
43
-
44
-
45
-
46
-
47
-
48
-
49
-
50
-
51
-
52
-
53
-
54
-
55
-
56
-
57
-
58
-
59
-
60
-
61
-
62
-
63
-
64
-
65
-
66
-
67
-
68
-
69
-
 70
70 -
 71
71 -
 72
72 -
 73
73 -
 74
74 -
 75
75 -
 76
76 -
 77
77 -
 78
78 -
 79
79 -
 80
80 -
 81
81 -
 82
82 -
 83
83 -
 84
84 -
 85
85 -
 86
86 -
 87
87 -
 88
88 -
 89
89 -
 90
90 -
91
-
92
-
93
-
94
-
95
-
96
-
97
-
98
-
99
-
100
-
101
-
102
-
103
-
104
-
105
-
106
-
107
-
108
-
109
-
110
-
111
-
112
-
113
-
114
-
115
-
116
-
117
-
118
-
119
-
120
-
121
-
122
-
123
-
124
-
125
-
126
-
127
-
128
-
129
-
130
-
131
-
132
-
133
-
134
-
135
-
136
-
137
-
138
-
139
-
140
-
141
-
142
-
143
-
144
-
145
-
146
-
147
-
148
-
149
-
150
-
151
-
152
-
153
-
154
-
155
-
156
-
157
-
158
-
159
-
160
-
161
-
162
-
163
-
164
-
165
-
166
-
167
-
168
-
169
-
170
-
171
-
172
-
173
-
174
-
175
-
176
-
177
-
178
-
179
-
180
-
181
-
182
-
183
-
184
-
185
-
186
-
187
-
188
-
189
-
190
-
191
-
192
-
193
-
194
-
195
-
196
-
197
-
198
-
199
-
200
-
201
-
202
-
203
-
204
-
205
-
206
-
207
-
208
-
209
-
210
-
211
-
212
-
213
-
214
-
215
-
216
-
217
-
218
-
219
-
220
-
221
-
222
-
223
-
224
-
225
-
226
-
227
-
228
-
229
-
230
-
231
-
232
-
233
-
234
-
235
-
236
-
237
-
238
-
239
-
240
-
241
-
242
-
243
-
244
-
245
-
246
-
247
-
248
-
249
-
250
-
251
-
252
-
253
-
254
-
255
-
256
-
257
-
258
-
259
-
260
-
261
-
262
-
263
-
264
-
265
-
266
-
267
-
268
-
269
-
270
-
271
-
272
-
273
-
274
-
275
-
276
-
277
-
278
-
279
-
280
 |
 |
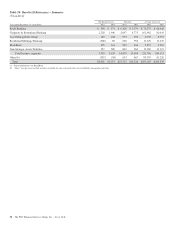
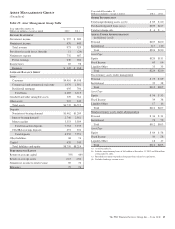
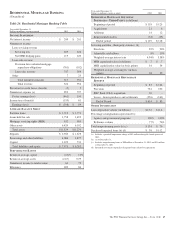
showed a decline as loan demand was outpaced by
paydowns, refinancing and charge-offs. Retail
Banking’s home equity loan portfolio is relationship
based, with 97% of the portfolio attributable to
borrowers in our primary geographic footprint.
• Average commercial and commercial real estate
loans increased $631 million, or 6%, over 2011. The
increase was due to the acquisition of RBC Bank
(USA). The remainder of the portfolio showed a
decline as loan demand was outpaced by paydowns,
refinancing and charge-offs.
• Average auto dealer floor plan loans grew $338
million, or 23%, in 2012, primarily resulting from
dealer line utilization and additional dealer
relationships.
• Average credit card balances increased $325 million,
or 9%, over 2011 as a result of the portfolio purchase
from RBC Bank (Georgia), National Association in
March 2012 and organic customer growth.
• Average education loans were down $225 million, or
2%, from 2011 as paydowns and charge-offs in the
discontinued government guaranteed portfolio
outpaced growth in the private portfolio.
• Average indirect other and residential mortgages in
this segment are primarily run-off portfolios and
declined $317 million and $234 million, respectively,
in 2012. The indirect other portfolio is comprised of
marine, RV, and other indirect loan products.
Nonperforming assets increased $298 million to $1.1 billion
due to a change in policy on home equity loans, implemented
in the first quarter of 2012, which places these loans on
nonaccrual status at 90 days past due (versus the prior policy
of 180 days) as well as the implementation of regulatory
guidance issued in the third quarter of 2012 related to troubled
debt restructurings resulting from bankruptcy. These increases
were partially offset by a decline in the level of commercial
nonperforming assets.
The PNC Financial Services Group, Inc. – Form 10-K 61