PNC Bank 2012 Annual Report Download - page 219
Download and view the complete annual report
Please find page 219 of the 2012 PNC Bank annual report below. You can navigate through the pages in the report by either clicking on the pages listed below, or by using the keyword search tool below to find specific information within the annual report.-
 1
1 -
2
-
3
-
4
-
5
-
6
-
7
-
8
-
9
-
10
-
11
-
12
-
13
-
14
-
15
-
16
-
17
-
18
-
19
-
20
-
21
-
22
-
23
-
24
-
25
-
26
-
27
-
28
-
29
-
30
-
31
-
32
-
33
-
34
-
35
-
36
-
37
-
38
-
39
-
40
-
41
-
42
-
43
-
44
-
45
-
46
-
47
-
48
-
49
-
50
-
51
-
52
-
53
-
54
-
55
-
56
-
57
-
58
-
59
-
60
-
61
-
62
-
63
-
64
-
65
-
66
-
67
-
68
-
69
-
70
-
71
-
72
-
73
-
74
-
75
-
76
-
77
-
78
-
79
-
80
-
81
-
82
-
83
-
84
-
85
-
86
-
87
-
88
-
89
-
90
-
91
-
92
-
93
-
94
-
95
-
96
-
97
-
98
-
99
-
100
-
101
-
102
-
103
-
104
-
105
-
106
-
107
-
108
-
109
-
110
-
111
-
112
-
113
-
114
-
115
-
116
-
117
-
118
-
119
-
120
-
121
-
122
-
123
-
124
-
125
-
126
-
127
-
128
-
129
-
130
-
131
-
132
-
133
-
134
-
135
-
136
-
137
-
138
-
139
-
140
-
141
-
142
-
143
-
144
-
145
-
146
-
147
-
148
-
149
-
150
-
151
-
152
-
153
-
154
-
155
-
156
-
157
-
158
-
159
-
160
-
161
-
162
-
163
-
164
-
165
-
166
-
167
-
168
-
169
-
170
-
171
-
172
-
173
-
174
-
175
-
176
-
177
-
178
-
179
-
180
-
181
-
182
-
183
-
184
-
185
-
186
-
187
-
188
-
189
-
190
-
191
-
192
-
193
-
194
-
195
-
196
-
197
-
198
-
199
-
200
-
201
-
202
-
203
-
204
-
205
-
206
-
207
-
208
-
 209
209 -
 210
210 -
 211
211 -
 212
212 -
 213
213 -
 214
214 -
 215
215 -
 216
216 -
 217
217 -
 218
218 -
 219
219 -
 220
220 -
 221
221 -
 222
222 -
 223
223 -
 224
224 -
 225
225 -
 226
226 -
 227
227 -
 228
228 -
 229
229 -
230
-
231
-
232
-
233
-
234
-
235
-
236
-
237
-
238
-
239
-
240
-
241
-
242
-
243
-
244
-
245
-
246
-
247
-
248
-
249
-
250
-
251
-
252
-
253
-
254
-
255
-
256
-
257
-
258
-
259
-
260
-
261
-
262
-
263
-
264
-
265
-
266
-
267
-
268
-
269
-
270
-
271
-
272
-
273
-
274
-
275
-
276
-
277
-
278
-
279
-
280
 |
 |

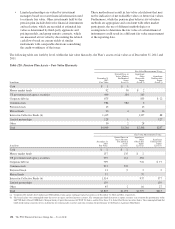
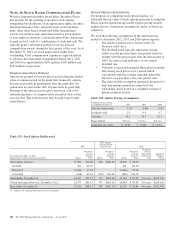
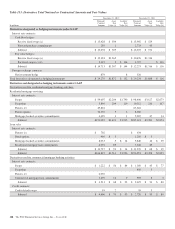
The components of net periodic benefit cost/(income) and other amounts recognized in Other comprehensive income (OCI) were
as follows.
Table 123: Components of Net Periodic Benefit Cost
Qualified Pension Plan Nonqualified Pension Plan Postretirement Benefits
Year ended December 31 – in millions 2012 2011 2010 2012 2011 2010 2012 2011 2010
Net periodic cost consists of:
Service cost $ 101 $ 94 $ 102 $ 4 $ 4 $ 3 $ 5 $ 7 $ 5
Interest cost 191 196 203 14 13 14 16 19 20
Expected return on plan assets (284) (298) (285)
Amortization of prior service cost/(credit) (8) (8) (8) (3) (3) (3)
Amortization of actuarial (gain)/loss 89 19 34653(1)
Net periodic cost (benefit) 89 3 46 24 22 20 17 23 22
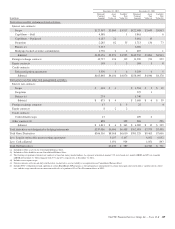
Other changes in plan assets and benefit obligations recognized in
Other comprehensive income:
Amortization of prior service (cost)/credit 8 8 8 3 3 3
Current year actuarial loss/(gain) 112 579 (99) 27 15 11 (18) (1) 21
Amortization of actuarial gain/(loss) (89) (19) (34) (6) (5) (3) (1)
Total recognized in OCI 31 568 (125) 21 10 8 (15) 1 24
Total recognized in net periodic cost and OCI $ 120 $ 571 $ (79) $45 $32 $28 $ 2 $24 $46
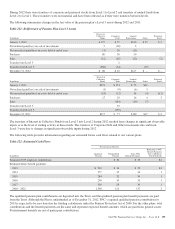
The weighted-average assumptions used (as of the beginning
of each year) to determine the net periodic costs shown above
were as follows.
Table 124: Net Periodic Costs – Assumptions
Net Periodic Cost Determination
Year ended December 31 2012 2011 2010
Discount rate
Qualified pension 4.60% 5.20% 5.75%
Nonqualified pension 4.20 4.80 5.15
Postretirement benefits 4.40 5.00 5.40
Rate of compensation increase
(average) 4.00 4.00 4.00
Assumed health care cost trend rate
Initial trend 8.00 8.00 8.50
Ultimate trend 5.00 5.00 5.00
Year ultimate reached 2019 2019 2014
Expected long-term return on plan
assets 7.75 7.75 8.00
The weighted-average assumptions used (as of the end of each
year) to determine year end obligations for pension and
postretirement benefits were as follows.
Table 125: Other Pension Assumptions
At December 31
Year ended December 31 2012 2011
Discount rate
Qualified pension 3.80% 4.60%
Nonqualified pension 3.45 4.20
Postretirement benefits 3.60 4.40
Rate of compensation increase (average) 4.00 4.00
Assumed health care cost trend rate
Initial trend 8.00 8.00
Ultimate trend 5.00 5.00
Year ultimate reached 2019 2019
The discount rates are determined independently for each plan
by comparing the expected future benefits that will be paid
under each plan with yields available on high quality
corporate bonds of similar duration. For this analysis, 10% of
bonds with the highest yields and 40% with the lowest yields
were removed from the bond universe.
The expected return on plan assets is a long-term assumption
established by considering historical and anticipated returns of
the asset classes invested in by the pension plan and the
allocation strategy currently in place among those classes. We
review this assumption at each measurement date and adjust it
if warranted. This assumption will be changed from 7.75% to
7.50% for determining 2013 net periodic cost.
200 The PNC Financial Services Group, Inc. – Form 10-K