PNC Bank 2012 Annual Report Download - page 98
Download and view the complete annual report
Please find page 98 of the 2012 PNC Bank annual report below. You can navigate through the pages in the report by either clicking on the pages listed below, or by using the keyword search tool below to find specific information within the annual report.-
 1
1 -
2
-
3
-
4
-
5
-
6
-
7
-
8
-
9
-
10
-
11
-
12
-
13
-
14
-
15
-
16
-
17
-
18
-
19
-
20
-
21
-
22
-
23
-
24
-
25
-
26
-
27
-
28
-
29
-
30
-
31
-
32
-
33
-
34
-
35
-
36
-
37
-
38
-
39
-
40
-
41
-
42
-
43
-
44
-
45
-
46
-
47
-
48
-
49
-
50
-
51
-
52
-
53
-
54
-
55
-
56
-
57
-
58
-
59
-
60
-
61
-
62
-
63
-
64
-
65
-
66
-
67
-
68
-
69
-
70
-
71
-
72
-
73
-
74
-
75
-
76
-
77
-
78
-
79
-
80
-
81
-
82
-
83
-
84
-
85
-
86
-
87
-
 88
88 -
 89
89 -
 90
90 -
 91
91 -
 92
92 -
 93
93 -
 94
94 -
 95
95 -
 96
96 -
 97
97 -
 98
98 -
 99
99 -
 100
100 -
 101
101 -
 102
102 -
 103
103 -
 104
104 -
 105
105 -
 106
106 -
 107
107 -
 108
108 -
109
-
110
-
111
-
112
-
113
-
114
-
115
-
116
-
117
-
118
-
119
-
120
-
121
-
122
-
123
-
124
-
125
-
126
-
127
-
128
-
129
-
130
-
131
-
132
-
133
-
134
-
135
-
136
-
137
-
138
-
139
-
140
-
141
-
142
-
143
-
144
-
145
-
146
-
147
-
148
-
149
-
150
-
151
-
152
-
153
-
154
-
155
-
156
-
157
-
158
-
159
-
160
-
161
-
162
-
163
-
164
-
165
-
166
-
167
-
168
-
169
-
170
-
171
-
172
-
173
-
174
-
175
-
176
-
177
-
178
-
179
-
180
-
181
-
182
-
183
-
184
-
185
-
186
-
187
-
188
-
189
-
190
-
191
-
192
-
193
-
194
-
195
-
196
-
197
-
198
-
199
-
200
-
201
-
202
-
203
-
204
-
205
-
206
-
207
-
208
-
209
-
210
-
211
-
212
-
213
-
214
-
215
-
216
-
217
-
218
-
219
-
220
-
221
-
222
-
223
-
224
-
225
-
226
-
227
-
228
-
229
-
230
-
231
-
232
-
233
-
234
-
235
-
236
-
237
-
238
-
239
-
240
-
241
-
242
-
243
-
244
-
245
-
246
-
247
-
248
-
249
-
250
-
251
-
252
-
253
-
254
-
255
-
256
-
257
-
258
-
259
-
260
-
261
-
262
-
263
-
264
-
265
-
266
-
267
-
268
-
269
-
270
-
271
-
272
-
273
-
274
-
275
-
276
-
277
-
278
-
279
-
280
 |
 |

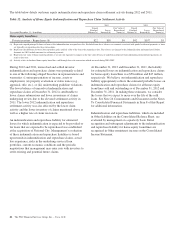
Indemnification and repurchase claims are typically settled on
an individual loan basis through make-whole payments or
loan repurchases; however, on occasion we may negotiate
pooled settlements with investors. In connection with pooled
settlements, we typically do not repurchase loans and the
consummation of such transactions generally results in us no
longer having indemnification and repurchase exposure with
the investor in the transaction.
For the first and second-lien mortgage balances of unresolved
and settled claims contained in the tables below, a significant
amount of these claims were associated with sold loans
originated through correspondent lender and broker
origination channels. In certain instances when
indemnification or repurchase claims are settled for these
types of sold loans, we have recourse back to the
correspondent lenders, brokers and other third-parties (e.g.,
contract underwriting companies, closing agents, appraisers,
etc.). Depending on the underlying reason for the investor
claim, we determine our ability to pursue recourse with these
parties and file claims with them accordingly. Our historical
recourse recovery rate has been insignificant as our efforts
have been impacted by the inability of such parties to
reimburse us for their recourse obligations (e.g., their capital
availability or whether they remain in business) or factors that
limit our ability to pursue recourse from these parties (e.g.,
contractual loss caps, statutes of limitations).
Origination and sale of residential mortgages is an ongoing
business activity, and, accordingly, management continually
assesses the need to recognize indemnification and repurchase
liabilities pursuant to the associated investor sale agreements.
We establish indemnification and repurchase liabilities for
estimated losses on sold first and second-lien mortgages for
which indemnification is expected to be provided or for loans
that are expected to be repurchased. For the first and second-
lien mortgage sold portfolio, we have established an
indemnification and repurchase liability pursuant to investor
sale agreements based on claims made, demand patterns
observed to date and/or expected in the future, and our
estimate of future claims on a loan by loan basis. To estimate
the mortgage repurchase liability arising from breaches of
representations and warranties, we consider the following
factors: (i) borrower performance in our historically sold
portfolio (both actual and estimated future defaults), (ii) the
level of outstanding unresolved repurchase claims,
(iii) estimated probable future repurchase claims, considering
information about file requests, delinquent and liquidated
loans, resolved and unresolved mortgage insurance rescission
notices and our historical experience with claim rescissions,
(iv) the potential ability to cure the defects identified in the
repurchase claims (“rescission rate”), and (v) the estimated
severity of loss upon repurchase of the loan or collateral,
make-whole settlement, or indemnification.
See Note 24 Commitments and Guarantees in the Notes To
Consolidated Financial Statements in Item 8 of this Report for
additional information.
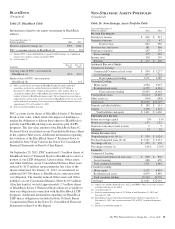
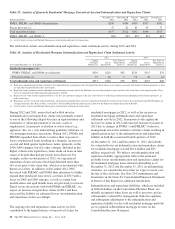
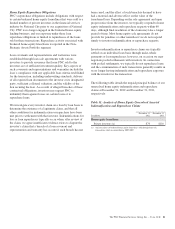
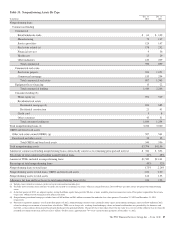
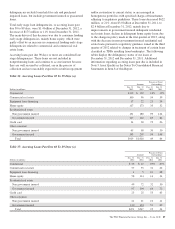
The following tables present the unpaid principal balance of repurchase claims by vintage and total unresolved repurchase claims
for the past five quarters.
Table 28: Analysis of Quarterly Residential Mortgage Repurchase Claims by Vintage
Dollars in millions
December 31
2012
September 30
2012
June 30
2012
March 31
2012
December 31
2011
2004 & Prior $ 11 $ 15 $ 31 $ 10 $ 11
2005 810191213
2006 23 30 56 41 28
2007 45 137 182 100 90
2008 723491718
2008 & Prior 94 215 337 180 160
2009 – 2012 38 52 42 33 29
Total $132 $267 $379 $213 $189
FNMA, FHLMC, and GNMA % 94% 87% 86% 88% 91%
The PNC Financial Services Group, Inc. – Form 10-K 79