PNC Bank 2012 Annual Report Download - page 160
Download and view the complete annual report
Please find page 160 of the 2012 PNC Bank annual report below. You can navigate through the pages in the report by either clicking on the pages listed below, or by using the keyword search tool below to find specific information within the annual report.-
 1
1 -
2
-
3
-
4
-
5
-
6
-
7
-
8
-
9
-
10
-
11
-
12
-
13
-
14
-
15
-
16
-
17
-
18
-
19
-
20
-
21
-
22
-
23
-
24
-
25
-
26
-
27
-
28
-
29
-
30
-
31
-
32
-
33
-
34
-
35
-
36
-
37
-
38
-
39
-
40
-
41
-
42
-
43
-
44
-
45
-
46
-
47
-
48
-
49
-
50
-
51
-
52
-
53
-
54
-
55
-
56
-
57
-
58
-
59
-
60
-
61
-
62
-
63
-
64
-
65
-
66
-
67
-
68
-
69
-
70
-
71
-
72
-
73
-
74
-
75
-
76
-
77
-
78
-
79
-
80
-
81
-
82
-
83
-
84
-
85
-
86
-
87
-
88
-
89
-
90
-
91
-
92
-
93
-
94
-
95
-
96
-
97
-
98
-
99
-
100
-
101
-
102
-
103
-
104
-
105
-
106
-
107
-
108
-
109
-
110
-
111
-
112
-
113
-
114
-
115
-
116
-
117
-
118
-
119
-
120
-
121
-
122
-
123
-
124
-
125
-
126
-
127
-
128
-
129
-
130
-
131
-
132
-
133
-
134
-
135
-
136
-
137
-
138
-
139
-
140
-
141
-
142
-
143
-
144
-
145
-
146
-
147
-
148
-
149
-
 150
150 -
 151
151 -
 152
152 -
 153
153 -
 154
154 -
 155
155 -
 156
156 -
 157
157 -
 158
158 -
 159
159 -
 160
160 -
 161
161 -
 162
162 -
 163
163 -
 164
164 -
 165
165 -
 166
166 -
 167
167 -
 168
168 -
 169
169 -
 170
170 -
171
-
172
-
173
-
174
-
175
-
176
-
177
-
178
-
179
-
180
-
181
-
182
-
183
-
184
-
185
-
186
-
187
-
188
-
189
-
190
-
191
-
192
-
193
-
194
-
195
-
196
-
197
-
198
-
199
-
200
-
201
-
202
-
203
-
204
-
205
-
206
-
207
-
208
-
209
-
210
-
211
-
212
-
213
-
214
-
215
-
216
-
217
-
218
-
219
-
220
-
221
-
222
-
223
-
224
-
225
-
226
-
227
-
228
-
229
-
230
-
231
-
232
-
233
-
234
-
235
-
236
-
237
-
238
-
239
-
240
-
241
-
242
-
243
-
244
-
245
-
246
-
247
-
248
-
249
-
250
-
251
-
252
-
253
-
254
-
255
-
256
-
257
-
258
-
259
-
260
-
261
-
262
-
263
-
264
-
265
-
266
-
267
-
268
-
269
-
270
-
271
-
272
-
273
-
274
-
275
-
276
-
277
-
278
-
279
-
280
 |
 |

V
ARIABLE
I
NTEREST
E
NTITIES
(VIE
S
)
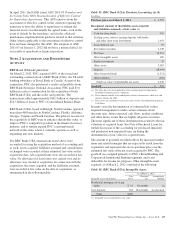
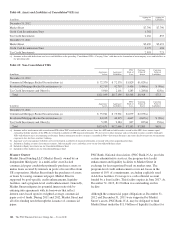
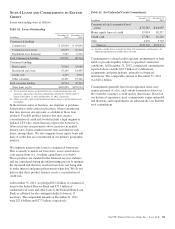
We are involved with various entities in the normal course of business that are deemed to be VIEs. We assess VIEs for
consolidation based upon the accounting policies described in Note 1 Accounting Policies. The following provides a summary of
VIEs, including those that we have consolidated and those in which we hold variable interests but have not consolidated into our
financial statements as of December 31, 2012 and December 31, 2011.
Table 59: Consolidated VIEs – Carrying Value (a) (b)
December 31, 2012
In millions Market Street
Credit Card
Securitization Trust (c)
Tax Credit
Investments Total
Assets
Cash and due from banks $4$ 4
Interest-earning deposits with banks 66
Investment securities $ 9 9
Loans 6,038 $1,743 7,781
Allowance for loan and lease losses (75) (75)
Equity investments 1,429 1,429
Other assets 536 31 714 1,281
Total assets $6,583 $1,699 $2,153 $10,435
Liabilities
Commercial paper $6,045 $ 6,045
Other borrowed funds $ 257 257
Accrued expenses 132 132
Other liabilities 529 447 976
Total liabilities $6,574 $ 836 $ 7,410
December 31, 2011
In millions Market Street
Credit Card
Securitization Trust
Tax Credit
Investments (b) Total
Assets
Cash and due from banks $7$7
Interest-earning deposits with banks $ 317 8 325
Investment securities $ 109 109
Loans 4,163 1,933 6,096
Allowance for loan and lease losses (91) (91)
Equity investments 1,643 1,643
Other assets 360 7 838 1,205
Total assets $4,632 $2,166 $2,496 $9,294
Liabilities
Commercial paper $4,271 $4,271
Other borrowed funds $ 287 $ 218 505
Accrued expenses 50 105 155
Other liabilities 355 379 734
Total liabilities $4,626 $ 337 $ 702 $5,665
(a) Amounts represent carrying value on PNC’s Consolidated Balance Sheet.
(b) Difference between total assets and total liabilities represents the equity portion of the VIE or intercompany assets and liabilities which are eliminated in consolidation.
(c) During the first quarter of 2012, the last securitization series issued by the SPE matured, resulting in the zero balance of liabilities at December 31, 2012.
The PNC Financial Services Group, Inc. – Form 10-K 141