PNC Bank 2012 Annual Report Download - page 188
Download and view the complete annual report
Please find page 188 of the 2012 PNC Bank annual report below. You can navigate through the pages in the report by either clicking on the pages listed below, or by using the keyword search tool below to find specific information within the annual report.-
 1
1 -
2
-
3
-
4
-
5
-
6
-
7
-
8
-
9
-
10
-
11
-
12
-
13
-
14
-
15
-
16
-
17
-
18
-
19
-
20
-
21
-
22
-
23
-
24
-
25
-
26
-
27
-
28
-
29
-
30
-
31
-
32
-
33
-
34
-
35
-
36
-
37
-
38
-
39
-
40
-
41
-
42
-
43
-
44
-
45
-
46
-
47
-
48
-
49
-
50
-
51
-
52
-
53
-
54
-
55
-
56
-
57
-
58
-
59
-
60
-
61
-
62
-
63
-
64
-
65
-
66
-
67
-
68
-
69
-
70
-
71
-
72
-
73
-
74
-
75
-
76
-
77
-
78
-
79
-
80
-
81
-
82
-
83
-
84
-
85
-
86
-
87
-
88
-
89
-
90
-
91
-
92
-
93
-
94
-
95
-
96
-
97
-
98
-
99
-
100
-
101
-
102
-
103
-
104
-
105
-
106
-
107
-
108
-
109
-
110
-
111
-
112
-
113
-
114
-
115
-
116
-
117
-
118
-
119
-
120
-
121
-
122
-
123
-
124
-
125
-
126
-
127
-
128
-
129
-
130
-
131
-
132
-
133
-
134
-
135
-
136
-
137
-
138
-
139
-
140
-
141
-
142
-
143
-
144
-
145
-
146
-
147
-
148
-
149
-
150
-
151
-
152
-
153
-
154
-
155
-
156
-
157
-
158
-
159
-
160
-
161
-
162
-
163
-
164
-
165
-
166
-
167
-
168
-
169
-
170
-
171
-
172
-
173
-
174
-
175
-
176
-
177
-
 178
178 -
 179
179 -
 180
180 -
 181
181 -
 182
182 -
 183
183 -
 184
184 -
 185
185 -
 186
186 -
 187
187 -
 188
188 -
 189
189 -
 190
190 -
 191
191 -
 192
192 -
 193
193 -
 194
194 -
 195
195 -
 196
196 -
 197
197 -
 198
198 -
199
-
200
-
201
-
202
-
203
-
204
-
205
-
206
-
207
-
208
-
209
-
210
-
211
-
212
-
213
-
214
-
215
-
216
-
217
-
218
-
219
-
220
-
221
-
222
-
223
-
224
-
225
-
226
-
227
-
228
-
229
-
230
-
231
-
232
-
233
-
234
-
235
-
236
-
237
-
238
-
239
-
240
-
241
-
242
-
243
-
244
-
245
-
246
-
247
-
248
-
249
-
250
-
251
-
252
-
253
-
254
-
255
-
256
-
257
-
258
-
259
-
260
-
261
-
262
-
263
-
264
-
265
-
266
-
267
-
268
-
269
-
270
-
271
-
272
-
273
-
274
-
275
-
276
-
277
-
278
-
279
-
280
 |
 |

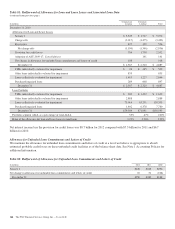
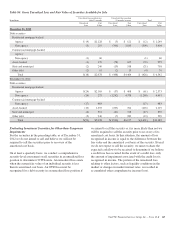
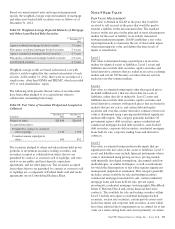
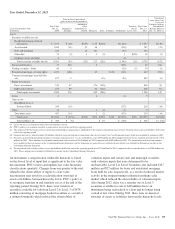
During 2012 and 2011, the OTTI credit losses recognized in noninterest income related to estimated credit losses on securities that
we do not expect to sell were as follows:
Table 86: Summary of OTTI Credit Losses Recognized in Earnings
Year ended December 31
In millions 2012 2011
Available for sale securities:
Non-agency residential mortgage-backed $ (99) $(130)
Asset-backed (11) (21)
Other debt (1) (1)
Total $(111) $(152)
Table 87: Summary of OTTI Noncredit (Losses) Recoveries Included in Accumulated Other Comprehensive Income (Loss)
In millions 2012 2011
Total $32 $(268)
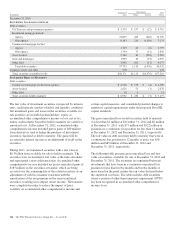
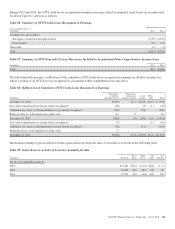
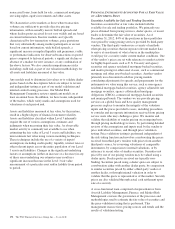
The following table presents a rollforward of the cumulative OTTI credit losses recognized in earnings for all debt securities for
which a portion of an OTTI loss was recognized in accumulated other comprehensive income (loss):
Table 88: Rollforward of Cumulative OTTI Credit Losses Recognized in Earnings
In millions
Non-agency
residential
mortgage-backed
Non-agency
commercial
mortgage-backed
Asset-
backed
Other
debt Total
December 31, 2010 $(709) $(11) $(223) $(12) $ (955)
Loss where impairment was not previously recognized (18) (3) (1) (22)
Additional loss where credit impairment was previously recognized (112) (18) (130)
Reduction due to credit impaired securities sold 11 5 16
December 31, 2011 (828) (6) (244) (13) (1,091)
Loss where impairment was not previously recognized (9) (1) (10)
Additional loss where credit impairment was previously recognized (90) (11) (101)
Reduction due to credit impaired securities sold 1 1
December 31, 2012 $(926) $ (6) $(255) $(14) $(1,201)
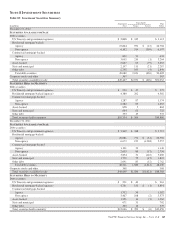
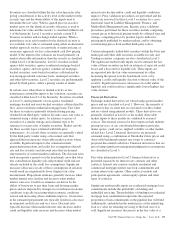
Information relating to gross realized securities gains and losses from the sales of securities is set forth in the following table.
Table 89: Gains (Losses) on Sales of Securities Available for Sale
In millions Proceeds
Gross
Gains
Gross
Losses
Net
Gains
Tax
Expense
For the year ended December 31
2012 $ 9,441 $214 $ (10) $204 $ 71
2011 21,039 406 (157) 249 87
2010 23,783 490 (64) 426 149
The PNC Financial Services Group, Inc. – Form 10-K 169