PNC Bank 2012 Annual Report Download - page 256
Download and view the complete annual report
Please find page 256 of the 2012 PNC Bank annual report below. You can navigate through the pages in the report by either clicking on the pages listed below, or by using the keyword search tool below to find specific information within the annual report.-
 1
1 -
2
-
3
-
4
-
5
-
6
-
7
-
8
-
9
-
10
-
11
-
12
-
13
-
14
-
15
-
16
-
17
-
18
-
19
-
20
-
21
-
22
-
23
-
24
-
25
-
26
-
27
-
28
-
29
-
30
-
31
-
32
-
33
-
34
-
35
-
36
-
37
-
38
-
39
-
40
-
41
-
42
-
43
-
44
-
45
-
46
-
47
-
48
-
49
-
50
-
51
-
52
-
53
-
54
-
55
-
56
-
57
-
58
-
59
-
60
-
61
-
62
-
63
-
64
-
65
-
66
-
67
-
68
-
69
-
70
-
71
-
72
-
73
-
74
-
75
-
76
-
77
-
78
-
79
-
80
-
81
-
82
-
83
-
84
-
85
-
86
-
87
-
88
-
89
-
90
-
91
-
92
-
93
-
94
-
95
-
96
-
97
-
98
-
99
-
100
-
101
-
102
-
103
-
104
-
105
-
106
-
107
-
108
-
109
-
110
-
111
-
112
-
113
-
114
-
115
-
116
-
117
-
118
-
119
-
120
-
121
-
122
-
123
-
124
-
125
-
126
-
127
-
128
-
129
-
130
-
131
-
132
-
133
-
134
-
135
-
136
-
137
-
138
-
139
-
140
-
141
-
142
-
143
-
144
-
145
-
146
-
147
-
148
-
149
-
150
-
151
-
152
-
153
-
154
-
155
-
156
-
157
-
158
-
159
-
160
-
161
-
162
-
163
-
164
-
165
-
166
-
167
-
168
-
169
-
170
-
171
-
172
-
173
-
174
-
175
-
176
-
177
-
178
-
179
-
180
-
181
-
182
-
183
-
184
-
185
-
186
-
187
-
188
-
189
-
190
-
191
-
192
-
193
-
194
-
195
-
196
-
197
-
198
-
199
-
200
-
201
-
202
-
203
-
204
-
205
-
206
-
207
-
208
-
209
-
210
-
211
-
212
-
213
-
214
-
215
-
216
-
217
-
218
-
219
-
220
-
221
-
222
-
223
-
224
-
225
-
226
-
227
-
228
-
229
-
230
-
231
-
232
-
233
-
234
-
235
-
236
-
237
-
238
-
239
-
240
-
241
-
242
-
243
-
244
-
245
-
 246
246 -
 247
247 -
 248
248 -
 249
249 -
 250
250 -
 251
251 -
 252
252 -
 253
253 -
 254
254 -
 255
255 -
 256
256 -
 257
257 -
 258
258 -
 259
259 -
 260
260 -
 261
261 -
 262
262 -
 263
263 -
 264
264 -
 265
265 -
 266
266 -
267
-
268
-
269
-
270
-
271
-
272
-
273
-
274
-
275
-
276
-
277
-
278
-
279
-
280
 |
 |

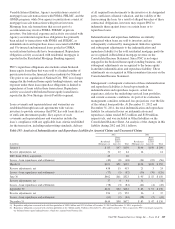
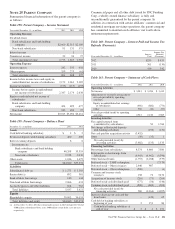
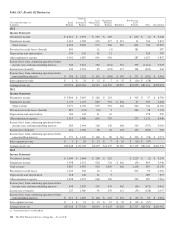
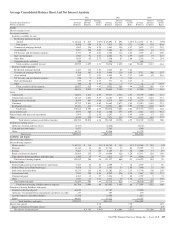
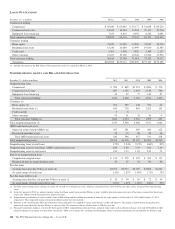
Average Consolidated Balance Sheet And Net Interest Analysis
2012 2011 2010
Taxable-equivalent basis
Dollars in millions
Average
Balances
Interest
Income/
Expense
Average
Yields/
Rates
Average
Balances
Interest
Income/
Expense
Average
Yields/
Rates
Average
Balances
Interest
Income/
Expense
Average
Yields/
Rates
Assets
Interest-earning assets:
Investment securities
Securities available for sale
Residential mortgage-backed
Agency $ 26,522 $ 815 3.07% $ 25,892 $ 894 3.45% $ 23,437 $ 911 3.89%
Non-agency 6,506 350 5.38 7,413 394 5.31 9,240 558 6.04
Commercial mortgage-backed 3,682 156 4.24 3,461 158 4.57 3,679 191 5.19
Asset-backed 5,227 106 2.03 3,402 84 2.47 2,240 83 3.71
US Treasury and government agencies 2,733 55 2.01 4,308 114 2.65 7,549 211 2.80
State and municipal 1,920 91 4.74 2,002 91 4.55 1,445 79 5.47
Other debt 3,019 82 2.72 3,350 87 2.60 2,783 79 2.84
Corporate stocks and other 350 428 448
Total securities available for sale 49,959 1,655 3.31 50,256 1,822 3.63 50,821 2,112 4.16
Securities held to maturity
Residential mortgage-backed 4,423 156 3.53 2,424 83 3.42
Commercial mortgage-backed 4,288 195 4.55 4,444 220 4.95 3,711 206 5.55
Asset-backed 892 17 1.91 1,985 43 2.17 3,409 89 2.61
US Treasury and government agencies 226 9 3.98 87 3 3.45
State and municipal 670 28 4.18 271 12 4.43 8
Other 358 10 2.79 221 7 3.17 41 6 14.63
Total securities held to maturity 10,857 415 3.82 9,432 368 3.90 7,169 301 4.20
Total investment securities 60,816 2,070 3.40 59,688 2,190 3.67 57,990 2,413 4.16
Loans
Commercial 76,654 3,447 4.50 59,437 2,924 4.92 54,339 2,888 5.31
Commercial real estate 18,115 1,005 5.55 16,767 879 5.24 20,435 1,045 5.11
Equipment lease financing 6,674 307 4.60 6,219 309 4.97 6,276 325 5.18
Consumer 59,752 2,801 4.69 54,669 2,673 4.89 55,015 2,865 5.21
Residential real estate 15,423 832 5.39 14,924 883 5.92 17,709 1,209 6.83
Total loans 176,618 8,392 4.75 152,016 7,668 5.04 153,774 8,332 5.42
Loans held for sale 2,977 168 5.64 2,768 193 6.97 2,871 263 9.16
Federal funds sold and resale agreements 1,594 22 1.38 2,297 33 1.44 1,899 37 1.95
Other 6,549 226 3.45 7,571 214 2.83 8,215 185 2.25
Total interest-earning assets/interest income 248,554 10,878 4.38 224,340 10,298 4.59 224,749 11,230 5.00
Noninterest-earning assets:
Allowance for loan and lease losses (4,157) (4,656) (5,144)
Cash and due from banks 3,877 3,565 3,569
Other 46,751 42,086 41,728
Total assets $295,025 $265,335 $264,902
Liabilities and Equity
Interest-bearing liabilities:
Interest-bearing deposits
Money market $ 65,933 $ 138 .21% $ 58,765 $ 184 .31% $ 58,264 $ 261 .45%
Demand 34,342 14 .04 27,563 23 .08 25,025 33 .13
Savings 9,863 9 .09 8,185 15 .18 7,005 13 .19
Retail certificates of deposit 26,609 210 .79 34,009 428 1.26 42,933 628 1.46
Time deposits in foreign offices and other time 3,195 15 .47 2,815 18 .64 3,598 28 .78
Total interest-bearing deposits 139,942 386 .28 131,337 668 .51 136,825 963 .70
Borrowed funds
Federal funds purchased and repurchase agreements 4,542 10 .22 4,469 7 .16 4,309 13 .30
Federal Home Loan Bank borrowings 9,678 72 .74 5,305 53 1.00 7,996 71 .89
Bank notes and senior debt 10,275 236 2.30 11,202 252 2.25 12,790 320 2.50
Subordinated debt 7,019 320 4.56 8,942 456 5.10 9,647 505 5.23
Commercial paper 8,383 23 .27 3,234 9 .28 2,707 9 .33
Other 1,947 47 2.41 2,574 49 1.90 2,731 41 1.50
Total borrowed funds 41,844 708 1.69 35,726 826 2.31 40,180 959 2.39
Total interest-bearing liabilities/interest expense 181,786 1,094 .60 167,063 1,494 .89 177,005 1,922 1.09
Noninterest-bearing liabilities and equity:
Noninterest-bearing deposits 61,610 51,707 45,076
Allowance for unfunded loan commitments and letters of credit 237 203 239
Accrued expenses and other liabilities 11,350 11,040 11,015
Equity 40,042 35,322 31,567
Total liabilities and equity $295,025 $265,335 $264,902
Interest rate spread 3.78 3.70 3.91
Impact of noninterest-bearing sources .16 .22 .23
Net interest income/margin $ 9,784 3.94% $ 8,804 3.92% $ 9,308 4.14%
The PNC Financial Services Group, Inc. – Form 10-K 237