PNC Bank 2012 Annual Report Download - page 229
Download and view the complete annual report
Please find page 229 of the 2012 PNC Bank annual report below. You can navigate through the pages in the report by either clicking on the pages listed below, or by using the keyword search tool below to find specific information within the annual report.-
 1
1 -
2
-
3
-
4
-
5
-
6
-
7
-
8
-
9
-
10
-
11
-
12
-
13
-
14
-
15
-
16
-
17
-
18
-
19
-
20
-
21
-
22
-
23
-
24
-
25
-
26
-
27
-
28
-
29
-
30
-
31
-
32
-
33
-
34
-
35
-
36
-
37
-
38
-
39
-
40
-
41
-
42
-
43
-
44
-
45
-
46
-
47
-
48
-
49
-
50
-
51
-
52
-
53
-
54
-
55
-
56
-
57
-
58
-
59
-
60
-
61
-
62
-
63
-
64
-
65
-
66
-
67
-
68
-
69
-
70
-
71
-
72
-
73
-
74
-
75
-
76
-
77
-
78
-
79
-
80
-
81
-
82
-
83
-
84
-
85
-
86
-
87
-
88
-
89
-
90
-
91
-
92
-
93
-
94
-
95
-
96
-
97
-
98
-
99
-
100
-
101
-
102
-
103
-
104
-
105
-
106
-
107
-
108
-
109
-
110
-
111
-
112
-
113
-
114
-
115
-
116
-
117
-
118
-
119
-
120
-
121
-
122
-
123
-
124
-
125
-
126
-
127
-
128
-
129
-
130
-
131
-
132
-
133
-
134
-
135
-
136
-
137
-
138
-
139
-
140
-
141
-
142
-
143
-
144
-
145
-
146
-
147
-
148
-
149
-
150
-
151
-
152
-
153
-
154
-
155
-
156
-
157
-
158
-
159
-
160
-
161
-
162
-
163
-
164
-
165
-
166
-
167
-
168
-
169
-
170
-
171
-
172
-
173
-
174
-
175
-
176
-
177
-
178
-
179
-
180
-
181
-
182
-
183
-
184
-
185
-
186
-
187
-
188
-
189
-
190
-
191
-
192
-
193
-
194
-
195
-
196
-
197
-
198
-
199
-
200
-
201
-
202
-
203
-
204
-
205
-
206
-
207
-
208
-
209
-
210
-
211
-
212
-
213
-
214
-
215
-
216
-
217
-
218
-
 219
219 -
 220
220 -
 221
221 -
 222
222 -
 223
223 -
 224
224 -
 225
225 -
 226
226 -
 227
227 -
 228
228 -
 229
229 -
 230
230 -
 231
231 -
 232
232 -
 233
233 -
 234
234 -
 235
235 -
 236
236 -
 237
237 -
 238
238 -
 239
239 -
240
-
241
-
242
-
243
-
244
-
245
-
246
-
247
-
248
-
249
-
250
-
251
-
252
-
253
-
254
-
255
-
256
-
257
-
258
-
259
-
260
-
261
-
262
-
263
-
264
-
265
-
266
-
267
-
268
-
269
-
270
-
271
-
272
-
273
-
274
-
275
-
276
-
277
-
278
-
279
-
280
 |
 |

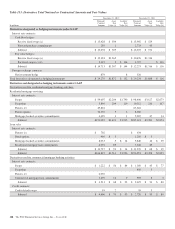
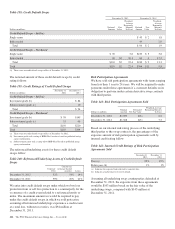
Gains (losses) on derivative instruments and related hedged items follow:
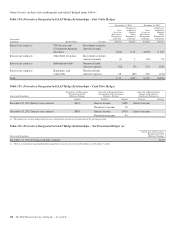
Table 134: Derivatives Designated in GAAP Hedge Relationships – Fair Value Hedges
December 31, 2012 December 31, 2011
Year ended
In millions
Gain
(Loss) on
Derivatives
Recognized
in Income
Gain (Loss)
on Related
Hedged
Items
Recognized
in Income
Gain
(Loss) on
Derivatives
Recognized
in Income
Gain (Loss)
on Related
Hedged
Items
Recognized
in Income
Hedged Items Location Amount Amount Amount Amount
Interest rate contracts US Treasury and
Government Agencies
Securities
Investment securities
(interest income)
$(26) $ 23 $(153) $ 162
Interest rate contracts Other Debt Securities Investment securities
(interest income) (1) 1 (23) 23
Interest rate contracts Subordinated debt Borrowed funds
(interest expense) (30) (9) 214 (229)
Interest rate contracts Bank notes and
senior debt
Borrowed funds
(interest expense) 68 (80) 265 (276)
Total $ 11 $(65) $ 303 $(320)
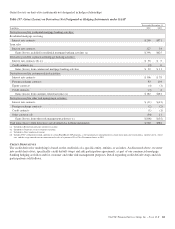
Table 135: Derivatives Designated in GAAP Hedge Relationships – Cash Flow Hedges
Year ended In millions
Gain (Loss) on Derivatives
Recognized in OCI
(Effective Portion)
Gain (Loss) Reclassified from
Accumulated OCI into Income
(Effective Portion)
Gain (Loss) Recognized in
Income on Derivatives
(Ineffective Portion) (a)
Amount Location Amount Location Amount
December 31, 2012 Interest rate contracts $312 Interest income $456 Interest income
Noninterest income 76
December 31, 2011 Interest rate contracts $805 Interest income $455 Interest income
Noninterest income 43
(a) The amount of cash flow hedge ineffectiveness recognized in income was not material for the periods presented.
Table 136: Derivatives Designated in GAAP Hedge Relationships – Net Investment Hedges (a)
Year ended In millions
Gain (Loss) on Derivatives
Recognized in OCI
(Effective Portion)
December 31, 2012 Foreign exchange contracts $(27)
(a) The loss recognized in Accumulated other comprehensive income was less than $1 million as of December 31, 2011.
210 The PNC Financial Services Group, Inc. – Form 10-K