PNC Bank 2012 Annual Report Download - page 5
Download and view the complete annual report
Please find page 5 of the 2012 PNC Bank annual report below. You can navigate through the pages in the report by either clicking on the pages listed below, or by using the keyword search tool below to find specific information within the annual report.-
 1
1 -
 2
2 -
 3
3 -
 4
4 -
 5
5 -
 6
6 -
 7
7 -
 8
8 -
 9
9 -
 10
10 -
 11
11 -
 12
12 -
 13
13 -
 14
14 -
 15
15 -
 16
16 -
17
-
18
-
19
-
20
-
21
-
22
-
23
-
24
-
25
-
26
-
27
-
28
-
29
-
30
-
31
-
32
-
33
-
34
-
35
-
36
-
37
-
38
-
39
-
40
-
41
-
42
-
43
-
44
-
45
-
46
-
47
-
48
-
49
-
50
-
51
-
52
-
53
-
54
-
55
-
56
-
57
-
58
-
59
-
60
-
61
-
62
-
63
-
64
-
65
-
66
-
67
-
68
-
69
-
70
-
71
-
72
-
73
-
74
-
75
-
76
-
77
-
78
-
79
-
80
-
81
-
82
-
83
-
84
-
85
-
86
-
87
-
88
-
89
-
90
-
91
-
92
-
93
-
94
-
95
-
96
-
97
-
98
-
99
-
100
-
101
-
102
-
103
-
104
-
105
-
106
-
107
-
108
-
109
-
110
-
111
-
112
-
113
-
114
-
115
-
116
-
117
-
118
-
119
-
120
-
121
-
122
-
123
-
124
-
125
-
126
-
127
-
128
-
129
-
130
-
131
-
132
-
133
-
134
-
135
-
136
-
137
-
138
-
139
-
140
-
141
-
142
-
143
-
144
-
145
-
146
-
147
-
148
-
149
-
150
-
151
-
152
-
153
-
154
-
155
-
156
-
157
-
158
-
159
-
160
-
161
-
162
-
163
-
164
-
165
-
166
-
167
-
168
-
169
-
170
-
171
-
172
-
173
-
174
-
175
-
176
-
177
-
178
-
179
-
180
-
181
-
182
-
183
-
184
-
185
-
186
-
187
-
188
-
189
-
190
-
191
-
192
-
193
-
194
-
195
-
196
-
197
-
198
-
199
-
200
-
201
-
202
-
203
-
204
-
205
-
206
-
207
-
208
-
209
-
210
-
211
-
212
-
213
-
214
-
215
-
216
-
217
-
218
-
219
-
220
-
221
-
222
-
223
-
224
-
225
-
226
-
227
-
228
-
229
-
230
-
231
-
232
-
233
-
234
-
235
-
236
-
237
-
238
-
239
-
240
-
241
-
242
-
243
-
244
-
245
-
246
-
247
-
248
-
249
-
250
-
251
-
252
-
253
-
254
-
255
-
256
-
257
-
258
-
259
-
260
-
261
-
262
-
263
-
264
-
265
-
266
-
267
-
268
-
269
-
270
-
271
-
272
-
273
-
274
-
275
-
276
-
277
-
278
-
279
-
280
 |
 |

There were clearly some pluses and minuses for PNC in 2012.
In addition to our growth in customers and gains in loans,
deposits and revenue, other positives included:
• Our balance sheet liquidity remained strong as
evidenced by our loan-to-deposit ratio of 87 percent
as of December 31, 2012.
• We exceeded our full-year cost reduction target of $550 million.
• Our Tier 1 capital ratio increased following our cash acquisition of RBC Bank (USA)
in March 2012.
There were also a few minuses, some of which reflect the current operating environment.
• Developments in the residential mortgage banking industry required us to set aside
a provision of $761 million primarily for obligations to repurchase loans that were
acquired when we purchased National City. This had a negative impact on revenue.
• On the expense side, residential mortgage foreclosure-related expenses were
$225 million for the year.
• Other expenses included integration costs of RBC Bank (USA) and the noncash charges
related to the redemption of $2.3 billion in high-cost trust preferred securities. Both
provide PNC with benefits in the form of an expanded footprint and lower funding costs,
respectively.
On balance this was a good year for PNC but because of these minuses, our financial results
do not reflect the full potential of the investments we have made and the value we believe
PNC can create for shareholders.
Pluses and Minuses
714,000 net new checking relationships during the year. Of that amount, 254,000 were net
new organic relationships, growth of 4 percent from year-end 2011 or more than double the
population growth rate in our footprint. Over the last three years, from 2010 through 2012, we
acquired about 3,000 new Corporate Banking primary clients. In 2012 compared with 2011,
new primary client acquisitions for our Asset Management Group were 37 percent higher
and Residential Mortgage originations increased by $3.8 billion or 33 percent.
This growth helped to create full year earnings of $3 billion or $5.30 per diluted common
share. Overall, I was pleased – but not entirely satisfied – with our results.
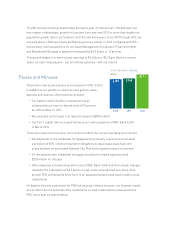
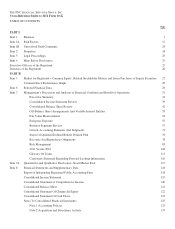
TOTAL DEPOSITS AT YEAR END
Billions
$183 $188
2010 2011 2012
$213