PNC Bank 2012 Annual Report Download - page 232
Download and view the complete annual report
Please find page 232 of the 2012 PNC Bank annual report below. You can navigate through the pages in the report by either clicking on the pages listed below, or by using the keyword search tool below to find specific information within the annual report.-
 1
1 -
2
-
3
-
4
-
5
-
6
-
7
-
8
-
9
-
10
-
11
-
12
-
13
-
14
-
15
-
16
-
17
-
18
-
19
-
20
-
21
-
22
-
23
-
24
-
25
-
26
-
27
-
28
-
29
-
30
-
31
-
32
-
33
-
34
-
35
-
36
-
37
-
38
-
39
-
40
-
41
-
42
-
43
-
44
-
45
-
46
-
47
-
48
-
49
-
50
-
51
-
52
-
53
-
54
-
55
-
56
-
57
-
58
-
59
-
60
-
61
-
62
-
63
-
64
-
65
-
66
-
67
-
68
-
69
-
70
-
71
-
72
-
73
-
74
-
75
-
76
-
77
-
78
-
79
-
80
-
81
-
82
-
83
-
84
-
85
-
86
-
87
-
88
-
89
-
90
-
91
-
92
-
93
-
94
-
95
-
96
-
97
-
98
-
99
-
100
-
101
-
102
-
103
-
104
-
105
-
106
-
107
-
108
-
109
-
110
-
111
-
112
-
113
-
114
-
115
-
116
-
117
-
118
-
119
-
120
-
121
-
122
-
123
-
124
-
125
-
126
-
127
-
128
-
129
-
130
-
131
-
132
-
133
-
134
-
135
-
136
-
137
-
138
-
139
-
140
-
141
-
142
-
143
-
144
-
145
-
146
-
147
-
148
-
149
-
150
-
151
-
152
-
153
-
154
-
155
-
156
-
157
-
158
-
159
-
160
-
161
-
162
-
163
-
164
-
165
-
166
-
167
-
168
-
169
-
170
-
171
-
172
-
173
-
174
-
175
-
176
-
177
-
178
-
179
-
180
-
181
-
182
-
183
-
184
-
185
-
186
-
187
-
188
-
189
-
190
-
191
-
192
-
193
-
194
-
195
-
196
-
197
-
198
-
199
-
200
-
201
-
202
-
203
-
204
-
205
-
206
-
207
-
208
-
209
-
210
-
211
-
212
-
213
-
214
-
215
-
216
-
217
-
218
-
219
-
220
-
221
-
 222
222 -
 223
223 -
 224
224 -
 225
225 -
 226
226 -
 227
227 -
 228
228 -
 229
229 -
 230
230 -
 231
231 -
 232
232 -
 233
233 -
 234
234 -
 235
235 -
 236
236 -
 237
237 -
 238
238 -
 239
239 -
 240
240 -
 241
241 -
 242
242 -
243
-
244
-
245
-
246
-
247
-
248
-
249
-
250
-
251
-
252
-
253
-
254
-
255
-
256
-
257
-
258
-
259
-
260
-
261
-
262
-
263
-
264
-
265
-
266
-
267
-
268
-
269
-
270
-
271
-
272
-
273
-
274
-
275
-
276
-
277
-
278
-
279
-
280
 |
 |

N
OTE
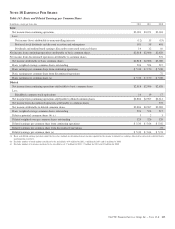
18 E
ARNINGS
P
ER
S
HARE
Table 143: Basic and Diluted Earnings per Common Share
In millions, except per share data 2012 2011 2010
Basic
Net income from continuing operations $3,001 $3,071 $3,024
Less:
Net income (loss) attributable to noncontrolling interests (12) 15 (15)
Preferred stock dividends and discount accretion and redemptions 181 58 401
Dividends and undistributed earnings allocated to nonvested restricted shares 14 12 10
Net income from continuing operations attributable to basic common shares $2,818 $2,986 $2,628
Net income from discontinued operations attributable to common shares 372
Net income attributable to basic common shares $2,818 $2,986 $3,000
Basic weighted-average common shares outstanding 526 524 517
Basic earnings per common share from continuing operations $ 5.36 $ 5.70 $ 5.08
Basic earnings per common share from discontinued operations .72
Basic earnings per common share (a) $ 5.36 $ 5.70 $ 5.80
Diluted
Net income from continuing operations attributable to basic common shares $2,818 $2,986 $2,628
Less:
BlackRock common stock equivalents 14 19 17
Net income from continuing operations attributable to diluted common shares $2,804 $2,967 $2,611
Net income from discontinued operations attributable to common shares 372
Net income attributable to diluted common shares $2,804 $2,967 $2,983
Basic weighted-average common shares outstanding 526 524 517
Dilutive potential common shares (b) (c) 3 2 3
Diluted weighted-average common shares outstanding 529 526 520
Diluted earnings per common share from continuing operations $ 5.30 $ 5.64 $ 5.02
Diluted earnings per common share from discontinued operations .72
Diluted earnings per common share (a) $ 5.30 $ 5.64 $ 5.74
(a) Basic and diluted earnings per share under the two-class method are determined on net income reported on the income statement less earnings allocated to nonvested restricted shares
(participating securities).
(b) Excludes number of stock options considered to be anti-dilutive of 4 million for 2012, 8 million for 2011 and 11 million for 2010.
(c) Excludes number of warrants considered to be anti-dilutive of 17 million for 2012, 17 million for 2011 and 22 million for 2010.
The PNC Financial Services Group, Inc. – Form 10-K 213