PNC Bank 2012 Annual Report Download - page 73
Download and view the complete annual report
Please find page 73 of the 2012 PNC Bank annual report below. You can navigate through the pages in the report by either clicking on the pages listed below, or by using the keyword search tool below to find specific information within the annual report.-
 1
1 -
2
-
3
-
4
-
5
-
6
-
7
-
8
-
9
-
10
-
11
-
12
-
13
-
14
-
15
-
16
-
17
-
18
-
19
-
20
-
21
-
22
-
23
-
24
-
25
-
26
-
27
-
28
-
29
-
30
-
31
-
32
-
33
-
34
-
35
-
36
-
37
-
38
-
39
-
40
-
41
-
42
-
43
-
44
-
45
-
46
-
47
-
48
-
49
-
50
-
51
-
52
-
53
-
54
-
55
-
56
-
57
-
58
-
59
-
60
-
61
-
62
-
 63
63 -
 64
64 -
 65
65 -
 66
66 -
 67
67 -
 68
68 -
 69
69 -
 70
70 -
 71
71 -
 72
72 -
 73
73 -
 74
74 -
 75
75 -
 76
76 -
 77
77 -
 78
78 -
 79
79 -
 80
80 -
 81
81 -
 82
82 -
 83
83 -
84
-
85
-
86
-
87
-
88
-
89
-
90
-
91
-
92
-
93
-
94
-
95
-
96
-
97
-
98
-
99
-
100
-
101
-
102
-
103
-
104
-
105
-
106
-
107
-
108
-
109
-
110
-
111
-
112
-
113
-
114
-
115
-
116
-
117
-
118
-
119
-
120
-
121
-
122
-
123
-
124
-
125
-
126
-
127
-
128
-
129
-
130
-
131
-
132
-
133
-
134
-
135
-
136
-
137
-
138
-
139
-
140
-
141
-
142
-
143
-
144
-
145
-
146
-
147
-
148
-
149
-
150
-
151
-
152
-
153
-
154
-
155
-
156
-
157
-
158
-
159
-
160
-
161
-
162
-
163
-
164
-
165
-
166
-
167
-
168
-
169
-
170
-
171
-
172
-
173
-
174
-
175
-
176
-
177
-
178
-
179
-
180
-
181
-
182
-
183
-
184
-
185
-
186
-
187
-
188
-
189
-
190
-
191
-
192
-
193
-
194
-
195
-
196
-
197
-
198
-
199
-
200
-
201
-
202
-
203
-
204
-
205
-
206
-
207
-
208
-
209
-
210
-
211
-
212
-
213
-
214
-
215
-
216
-
217
-
218
-
219
-
220
-
221
-
222
-
223
-
224
-
225
-
226
-
227
-
228
-
229
-
230
-
231
-
232
-
233
-
234
-
235
-
236
-
237
-
238
-
239
-
240
-
241
-
242
-
243
-
244
-
245
-
246
-
247
-
248
-
249
-
250
-
251
-
252
-
253
-
254
-
255
-
256
-
257
-
258
-
259
-
260
-
261
-
262
-
263
-
264
-
265
-
266
-
267
-
268
-
269
-
270
-
271
-
272
-
273
-
274
-
275
-
276
-
277
-
278
-
279
-
280
 |
 |
F
AIR
V
ALUE
M
EASUREMENTS
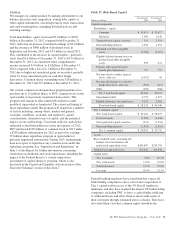
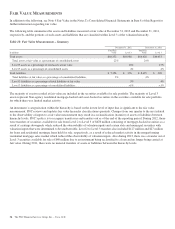
In addition to the following, see Note 9 Fair Value in the Notes To Consolidated Financial Statements in Item 8 of this Report for
further information regarding fair value.
The following table summarizes the assets and liabilities measured at fair value at December 31, 2012 and December 31, 2011,
respectively, and the portions of such assets and liabilities that are classified within Level 3 of the valuation hierarchy.
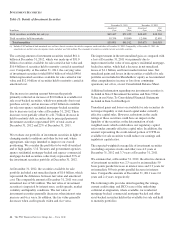
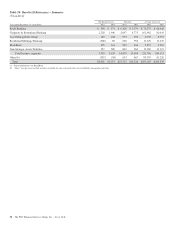
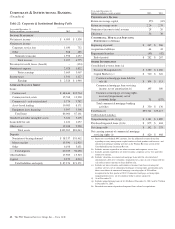
Table 18: Fair Value Measurements – Summary
December 31, 2012 December 31, 2011
In millions
Total Fair
Value Level 3
Total Fair
Value Level 3
Total assets $68,352 $10,988 $66,428 $10,053
Total assets at fair value as a percentage of consolidated assets 22% 24%
Level 3 assets as a percentage of total assets at fair value 16% 15%
Level 3 assets as a percentage of consolidated assets 4% 4%
Total liabilities $ 7,356 $ 376 $ 8,625 $ 308
Total liabilities at fair value as a percentage of consolidated liabilities 3% 4%
Level 3 liabilities as a percentage of total liabilities at fair value 5% 4%
Level 3 liabilities as a percentage of consolidated liabilities <1% <1%
The majority of assets recorded at fair value are included in the securities available for sale portfolio. The majority of Level 3
assets represent Non-agency residential mortgage-backed and asset-backed securities in the securities available for sale portfolio
for which there was limited market activity.
An instrument’s categorization within the hierarchy is based on the lowest level of input that is significant to the fair value
measurement. PNC reviews and updates fair value hierarchy classifications quarterly. Changes from one quarter to the next related
to the observability of inputs to a fair value measurement may result in a reclassification (transfer) of assets or liabilities between
hierarchy levels. PNC’s policy is to recognize transfers in and transfers out as of the end of the reporting period. During 2012, there
were transfers of securities available for sale from Level 2 to Level 3 of $478 million consisting of mortgage-backed securities as a
result of a ratings downgrade which reduced the observability of valuation inputs and certain state and municipal securities with
valuation inputs that were determined to be unobservable. Level 2 to Level 3 transfers also included $127 million and $27 million
for loans and residential mortgage loans held for sale, respectively, as a result of reduced market activity in the nonperforming
residential mortgage sales market which reduced the observability of valuation inputs. Also during 2012, there was a transfer out of
Level 3 securities available for sale of $40 million due to an instrument being reclassified to a loan and no longer being carried at
fair value. During 2011, there were no material transfers of assets or liabilities between the hierarchy levels.
54 The PNC Financial Services Group, Inc. – Form 10-K