PNC Bank 2012 Annual Report Download - page 260
Download and view the complete annual report
Please find page 260 of the 2012 PNC Bank annual report below. You can navigate through the pages in the report by either clicking on the pages listed below, or by using the keyword search tool below to find specific information within the annual report.-
 1
1 -
2
-
3
-
4
-
5
-
6
-
7
-
8
-
9
-
10
-
11
-
12
-
13
-
14
-
15
-
16
-
17
-
18
-
19
-
20
-
21
-
22
-
23
-
24
-
25
-
26
-
27
-
28
-
29
-
30
-
31
-
32
-
33
-
34
-
35
-
36
-
37
-
38
-
39
-
40
-
41
-
42
-
43
-
44
-
45
-
46
-
47
-
48
-
49
-
50
-
51
-
52
-
53
-
54
-
55
-
56
-
57
-
58
-
59
-
60
-
61
-
62
-
63
-
64
-
65
-
66
-
67
-
68
-
69
-
70
-
71
-
72
-
73
-
74
-
75
-
76
-
77
-
78
-
79
-
80
-
81
-
82
-
83
-
84
-
85
-
86
-
87
-
88
-
89
-
90
-
91
-
92
-
93
-
94
-
95
-
96
-
97
-
98
-
99
-
100
-
101
-
102
-
103
-
104
-
105
-
106
-
107
-
108
-
109
-
110
-
111
-
112
-
113
-
114
-
115
-
116
-
117
-
118
-
119
-
120
-
121
-
122
-
123
-
124
-
125
-
126
-
127
-
128
-
129
-
130
-
131
-
132
-
133
-
134
-
135
-
136
-
137
-
138
-
139
-
140
-
141
-
142
-
143
-
144
-
145
-
146
-
147
-
148
-
149
-
150
-
151
-
152
-
153
-
154
-
155
-
156
-
157
-
158
-
159
-
160
-
161
-
162
-
163
-
164
-
165
-
166
-
167
-
168
-
169
-
170
-
171
-
172
-
173
-
174
-
175
-
176
-
177
-
178
-
179
-
180
-
181
-
182
-
183
-
184
-
185
-
186
-
187
-
188
-
189
-
190
-
191
-
192
-
193
-
194
-
195
-
196
-
197
-
198
-
199
-
200
-
201
-
202
-
203
-
204
-
205
-
206
-
207
-
208
-
209
-
210
-
211
-
212
-
213
-
214
-
215
-
216
-
217
-
218
-
219
-
220
-
221
-
222
-
223
-
224
-
225
-
226
-
227
-
228
-
229
-
230
-
231
-
232
-
233
-
234
-
235
-
236
-
237
-
238
-
239
-
240
-
241
-
242
-
243
-
244
-
245
-
246
-
247
-
248
-
249
-
 250
250 -
 251
251 -
 252
252 -
 253
253 -
 254
254 -
 255
255 -
 256
256 -
 257
257 -
 258
258 -
 259
259 -
 260
260 -
 261
261 -
 262
262 -
 263
263 -
 264
264 -
 265
265 -
 266
266 -
 267
267 -
 268
268 -
 269
269 -
 270
270 -
271
-
272
-
273
-
274
-
275
-
276
-
277
-
278
-
279
-
280
 |
 |

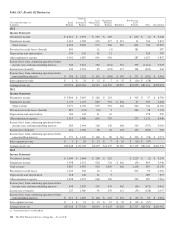
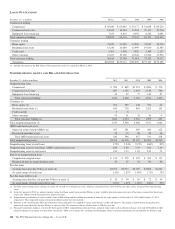
therefore a concession has been granted based upon discharge from personal liability. Charge-offs have been taken where the fair value less costs to sell the collateral was less than the
recorded investment of the loan and were $128.1 million. Of these loans, approximately 78% were current on their payments at December 31, 2012.
(f) Includes TDRs of $1,589 million at December 31, 2012, $1,141 million at December 31, 2011, $784 million at December 31, 2010, $440 million at December 31, 2009, and zero at
December 31, 2008, respectively. Nonperforming loans exclude certain government insured or guaranteed loans, loans held for sale, loans accounted for under the fair value option
and purchased impaired loans.
(g) OREO excludes $380 million, $280 million, $178 million, $112 million and $81 million at December 31, 2012, December 31, 2011, December 31, 2010, December 31, 2009 and
December 31, 2008, respectively, related to residential real estate that was acquired by us upon foreclosure of serviced loans because they are insured by the Federal Housing
Administration (FHA) or guaranteed by the Department of Veterans Affairs (VA).
(h) Amounts include certain government insured or guaranteed consumer loans totaling $2,236 million, $2,474 million, $2,167 million, $1,814 million and $926 million at December 31,
2012, December 31, 2011, December 31, 2010, December 31, 2009 and December 31, 2008, respectively. Past due loan amounts exclude purchased impaired loans as they are
considered current loans due to the accretion of interest income.
(i) Amounts include certain government insured or guaranteed consumer loans held for sale totaling zero, $15 million, $22 million, $27 million and zero at December 31,
2012, December 31, 2011, December 31, 2010, December 31, 2009 and December 31, 2008, respectively.
S
UMMARY OF
L
OAN
L
OSS
E
XPERIENCE
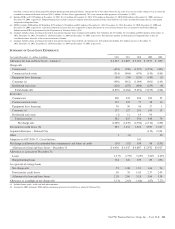
Year ended December 31 – dollars in millions 2012 2011 2010 2009 2008
Allowance for loan and lease losses – January 1 $ 4,347 $ 4,887 $ 5,072 $ 3,917 $ 830
Charge-offs
Commercial (474) (700) (1,227) (1,276) (301)
Commercial real estate (314) (464) (670) (510) (165)
Equipment lease financing (16) (35) (120) (149) (3)
Consumer (a) (956) (912) (1,069) (961) (143)
Residential real estate (110) (153) (406) (259) (6)
Total charge-offs (1,870) (2,264) (3,492) (3,155) (618)
Recoveries
Commercial 300 332 294 181 53
Commercial real estate 115 105 77 38 10
Equipment lease financing 30 50 56 27 1
Consumer (a) 137 127 110 105 15
Residential real estate (1) 11 19 93
Total recoveries 581 625 556 444 79
Net charge-offs (1,289) (1,639) (2,936) (2,711) (539)
Provision for credit losses (b) 987 1,152 2,502 3,930 1,517
Acquired allowance – National City (112) 2,224
Other 1 (1) 20
Adoption of ASU 2009-17, Consolidations 141
Net change in allowance for unfunded loan commitments and letters of credit (10) (52) 108 48 (135)
Allowance for loan and lease losses – December 31 $ 4,036 $ 4,347 $ 4,887 $ 5,072 $3,917
Allowance as a percent of December 31:
Loans 2.17% 2.73% 3.25% 3.22% 2.23%
Nonperforming loans 124 122 109 89 236
As a percent of average loans
Net charge-offs .73 1.08 1.91 1.64 .74
Provision for credit losses .56 .76 1.63 2.37 2.09
Allowance for loan and lease losses 2.28 2.86 3.18 3.06 5.38
Allowance as a multiple of net charge-offs 3.13x 2.65x 1.66x 1.87x 7.27x
(a) Includes home equity, credit card and other consumer.
(b) Amount for 2008 included a $504 million conforming provision for credit losses related to National City.
The PNC Financial Services Group, Inc. – Form 10-K 241