PNC Bank 2012 Annual Report Download - page 194
Download and view the complete annual report
Please find page 194 of the 2012 PNC Bank annual report below. You can navigate through the pages in the report by either clicking on the pages listed below, or by using the keyword search tool below to find specific information within the annual report.-
 1
1 -
2
-
3
-
4
-
5
-
6
-
7
-
8
-
9
-
10
-
11
-
12
-
13
-
14
-
15
-
16
-
17
-
18
-
19
-
20
-
21
-
22
-
23
-
24
-
25
-
26
-
27
-
28
-
29
-
30
-
31
-
32
-
33
-
34
-
35
-
36
-
37
-
38
-
39
-
40
-
41
-
42
-
43
-
44
-
45
-
46
-
47
-
48
-
49
-
50
-
51
-
52
-
53
-
54
-
55
-
56
-
57
-
58
-
59
-
60
-
61
-
62
-
63
-
64
-
65
-
66
-
67
-
68
-
69
-
70
-
71
-
72
-
73
-
74
-
75
-
76
-
77
-
78
-
79
-
80
-
81
-
82
-
83
-
84
-
85
-
86
-
87
-
88
-
89
-
90
-
91
-
92
-
93
-
94
-
95
-
96
-
97
-
98
-
99
-
100
-
101
-
102
-
103
-
104
-
105
-
106
-
107
-
108
-
109
-
110
-
111
-
112
-
113
-
114
-
115
-
116
-
117
-
118
-
119
-
120
-
121
-
122
-
123
-
124
-
125
-
126
-
127
-
128
-
129
-
130
-
131
-
132
-
133
-
134
-
135
-
136
-
137
-
138
-
139
-
140
-
141
-
142
-
143
-
144
-
145
-
146
-
147
-
148
-
149
-
150
-
151
-
152
-
153
-
154
-
155
-
156
-
157
-
158
-
159
-
160
-
161
-
162
-
163
-
164
-
165
-
166
-
167
-
168
-
169
-
170
-
171
-
172
-
173
-
174
-
175
-
176
-
177
-
178
-
179
-
180
-
181
-
182
-
183
-
 184
184 -
 185
185 -
 186
186 -
 187
187 -
 188
188 -
 189
189 -
 190
190 -
 191
191 -
 192
192 -
 193
193 -
 194
194 -
 195
195 -
 196
196 -
 197
197 -
 198
198 -
 199
199 -
 200
200 -
 201
201 -
 202
202 -
 203
203 -
 204
204 -
205
-
206
-
207
-
208
-
209
-
210
-
211
-
212
-
213
-
214
-
215
-
216
-
217
-
218
-
219
-
220
-
221
-
222
-
223
-
224
-
225
-
226
-
227
-
228
-
229
-
230
-
231
-
232
-
233
-
234
-
235
-
236
-
237
-
238
-
239
-
240
-
241
-
242
-
243
-
244
-
245
-
246
-
247
-
248
-
249
-
250
-
251
-
252
-
253
-
254
-
255
-
256
-
257
-
258
-
259
-
260
-
261
-
262
-
263
-
264
-
265
-
266
-
267
-
268
-
269
-
270
-
271
-
272
-
273
-
274
-
275
-
276
-
277
-
278
-
279
-
280
 |
 |
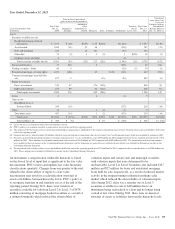
from brokers and investors is heavily relied upon.
Accordingly, based on the significance of unobservable
inputs, these loans are classified as Level 3.
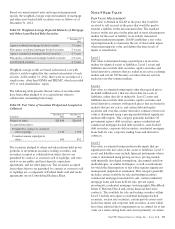
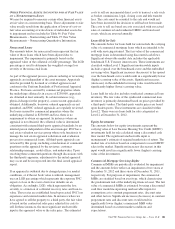
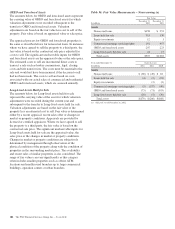
Residential Mortgage Servicing Rights
Residential mortgage servicing rights (MSRs) are carried at
fair value on a recurring basis. Assumptions incorporated into
the residential MSRs valuation model reflect management’s
best estimate of factors that a market participant would use in
valuing the residential MSRs. Although sales of residential
MSRs do occur, residential MSRs do not trade in an active,
open market with readily observable prices so the precise
terms and conditions of sales are not available. As a
benchmark for the reasonableness of its residential MSRs fair
value, PNC obtained opinions of value from independent
parties (“brokers”). These brokers provided a range (+/- 10
bps) based upon their own discounted cash flow calculations
of our portfolio that reflect conditions in the secondary market
and any recently executed servicing transactions. PNC
compares its internally-developed residential MSRs value to
the ranges of values received from the brokers. If our
residential MSRs fair value falls outside of the brokers’
ranges, management will assess whether a valuation
adjustment is warranted. For the periods presented, PNC’s
residential MSRs value did not fall outside of the brokers’
ranges. We consider our residential MSRs value to represent a
reasonable estimate of fair value. Due to the nature of the
valuation inputs, residential MSRs are classified as Level 3.
The significant unobservable inputs used in the fair value
measurement of residential MSRs are constant prepayment
rates and spread over the benchmark curve. Significant
increases (decreases) in prepayment rates and spread over the
benchmark curve would result in lower (higher) fair market
value of residential MSRs.
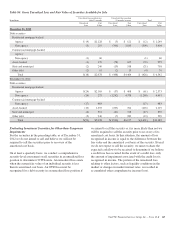
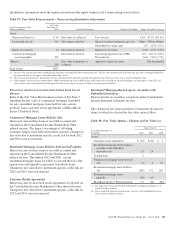
Commercial Mortgage Loans Held for Sale
We account for certain commercial mortgage loans classified
as held for sale at fair value. The election of the fair value
option aligns the accounting for the commercial mortgages
with the related hedges.
We determine the fair value of commercial mortgage loans
held for sale by using a discounted cash flow model. Fair
value is determined using sale valuation assumptions that
management believes a market participant would use in
pricing the loans. When available, valuation assumptions
include observable inputs based on the benchmark LIBOR
interest rate swap curve and whole loan sales. The significant
unobservable input is management’s assumption of the spread
applied to the benchmark rate. The spread over the benchmark
curve includes management’s assumptions of the impact of
credit and liquidity risk. Significant increases (decreases) in
the spread applied to the benchmark would result in a
significantly lower (higher) asset value. The wide range of the
spread over the benchmark curve is due to the varying risk and
underlying property characteristics within our portfolio. Based
on the significance of unobservable inputs, we classified this
portfolio as Level 3.
Equity Investments
The valuation of direct and indirect private equity investments
requires significant management judgment due to the absence
of quoted market prices, inherent lack of liquidity and the
long-term nature of such investments. The carrying values of
direct and affiliated partnership interests reflect the expected
exit price and are based on various techniques including
multiples of adjusted earnings of the entity, independent
appraisals, anticipated financing and sale transactions with
third parties, or the pricing used to value the entity in a recent
financing transaction. A multiple of adjusted earnings
calculation is the valuation technique utilized most frequently
and the multiple of earnings is the primary and most
significant unobservable input used in such calculation. The
multiple of earnings is utilized in conjunction with portfolio
company financial results and our ownership interest in
portfolio company securities to determine PNC’s interest in
the enterprise value of the portfolio company. Significant
decreases (increases) in the multiple of earnings could result
in a significantly lower (higher) fair value measurement. The
magnitude of the change in fair value is dependent on the
significance of the change in the multiple of earnings and the
significance of portfolio company adjusted earnings.
Valuation inputs or analysis are supported by portfolio
company or market documentation. Due to the size, private
and unique nature of each portfolio company, lack of liquidity
and the long-term nature of investments, relevant
benchmarking is not always feasible. A valuation committee
reviews the portfolio company valuations on a quarterly basis
and oversight is provided by senior management of the
business.
We value indirect investments in private equity funds based
on net asset value as provided in the financial statements that
we receive from their managers. Due to the time lag in our
receipt of the financial information and based on a review of
investments and valuation techniques applied, adjustments to
the manager-provided value are made when available recent
portfolio company information or market information
indicates a significant change in value from that provided by
the manager of the fund. These investments are classified as
Level 3.
Customer Resale Agreements
We have elected to account for structured resale agreements,
which are economically hedged using free-standing financial
derivatives, at fair value. The fair value for structured resale
agreements is determined using a model that includes
observable market data such as interest rates as inputs.
Readily observable market inputs to this model can be
validated to external sources, including yield curves, implied
volatility or other market-related data. These instruments are
classified as Level 2.
The PNC Financial Services Group, Inc. – Form 10-K 175