PNC Bank 2012 Annual Report Download - page 66
Download and view the complete annual report
Please find page 66 of the 2012 PNC Bank annual report below. You can navigate through the pages in the report by either clicking on the pages listed below, or by using the keyword search tool below to find specific information within the annual report.-
 1
1 -
2
-
3
-
4
-
5
-
6
-
7
-
8
-
9
-
10
-
11
-
12
-
13
-
14
-
15
-
16
-
17
-
18
-
19
-
20
-
21
-
22
-
23
-
24
-
25
-
26
-
27
-
28
-
29
-
30
-
31
-
32
-
33
-
34
-
35
-
36
-
37
-
38
-
39
-
40
-
41
-
42
-
43
-
44
-
45
-
46
-
47
-
48
-
49
-
50
-
51
-
52
-
53
-
54
-
55
-
 56
56 -
 57
57 -
 58
58 -
 59
59 -
 60
60 -
 61
61 -
 62
62 -
 63
63 -
 64
64 -
 65
65 -
 66
66 -
 67
67 -
 68
68 -
 69
69 -
 70
70 -
 71
71 -
 72
72 -
 73
73 -
 74
74 -
 75
75 -
 76
76 -
77
-
78
-
79
-
80
-
81
-
82
-
83
-
84
-
85
-
86
-
87
-
88
-
89
-
90
-
91
-
92
-
93
-
94
-
95
-
96
-
97
-
98
-
99
-
100
-
101
-
102
-
103
-
104
-
105
-
106
-
107
-
108
-
109
-
110
-
111
-
112
-
113
-
114
-
115
-
116
-
117
-
118
-
119
-
120
-
121
-
122
-
123
-
124
-
125
-
126
-
127
-
128
-
129
-
130
-
131
-
132
-
133
-
134
-
135
-
136
-
137
-
138
-
139
-
140
-
141
-
142
-
143
-
144
-
145
-
146
-
147
-
148
-
149
-
150
-
151
-
152
-
153
-
154
-
155
-
156
-
157
-
158
-
159
-
160
-
161
-
162
-
163
-
164
-
165
-
166
-
167
-
168
-
169
-
170
-
171
-
172
-
173
-
174
-
175
-
176
-
177
-
178
-
179
-
180
-
181
-
182
-
183
-
184
-
185
-
186
-
187
-
188
-
189
-
190
-
191
-
192
-
193
-
194
-
195
-
196
-
197
-
198
-
199
-
200
-
201
-
202
-
203
-
204
-
205
-
206
-
207
-
208
-
209
-
210
-
211
-
212
-
213
-
214
-
215
-
216
-
217
-
218
-
219
-
220
-
221
-
222
-
223
-
224
-
225
-
226
-
227
-
228
-
229
-
230
-
231
-
232
-
233
-
234
-
235
-
236
-
237
-
238
-
239
-
240
-
241
-
242
-
243
-
244
-
245
-
246
-
247
-
248
-
249
-
250
-
251
-
252
-
253
-
254
-
255
-
256
-
257
-
258
-
259
-
260
-
261
-
262
-
263
-
264
-
265
-
266
-
267
-
268
-
269
-
270
-
271
-
272
-
273
-
274
-
275
-
276
-
277
-
278
-
279
-
280
 |
 |

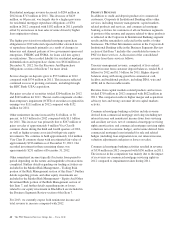
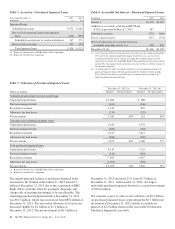
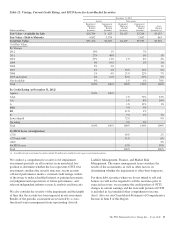
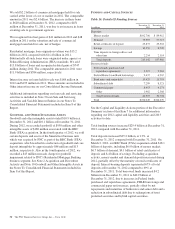
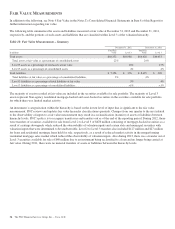
Table 12: Vintage, Current Credit Rating, and FICO Score for Asset-Backed Securities
December 31, 2012
Agency Non-agency
Dollars in millions
Residential
Mortgage-
Backed
Securities
Commercial
Mortgage-
Backed
Securities
Residential
Mortgage-
Backed
Securities
Commercial
Mortgage-
Backed
Securities
Asset-
Backed
Securities (a)
Fair Value – Available for Sale $26,784 $ 633 $6,107 $3,264 $5,653
Fair Value – Held to Maturity 4,582 1,374 2,667 863
Total Fair Value $31,366 $2,007 $6,107 $5,931 $6,516
% of Fair Value:
By Vintage
2012 19% 1% 7%
2011 27% 48% 6% 1%
2010 25% 11% 1% 4% 4%
2009 9% 19% 2% 1%
2008 2% 3% 1%
2007 2% 2% 25% 11% 2%
2006 1% 4% 21% 22% 7%
2005 and earlier 6% 12% 52% 47% 6%
Not Available 9% 1% 1% 78%
Total 100% 100% 100% 100% 100%
By Credit Rating (at December 31, 2012)
Agency 100% 100%
AAA 1% 72% 63%
AA 1% 8% 26%
A 1% 13% 1%
BBB 5% 3%
BB 11% 1%
B 7% 1% 1%
Lower than B 72% 9%
No rating 2% 2%
Total 100% 100% 100% 100% 100%
By FICO Score (at origination)
>720 56% 2%
<720 and >660 31% 6%
<660 2%
No FICO score 13% 90%
Total 100% 100%
(a) Available for sale asset-backed securities include $3 million of available for sale agency asset-backed securities.
We conduct a comprehensive security-level impairment
assessment quarterly on all securities in an unrealized loss
position to determine whether the loss represents OTTI. Our
assessment considers the security structure, recent security
collateral performance metrics, external credit ratings, failure
of the issuer to make scheduled interest or principal payments,
our judgment and expectations of future performance, and
relevant independent industry research, analysis and forecasts.
We also consider the severity of the impairment and the length
of time that the security has been impaired in our assessment.
Results of the periodic assessment are reviewed by a cross-
functional senior management team representing Asset &
Liability Management, Finance, and Market Risk
Management. The senior management team considers the
results of the assessments, as well as other factors, in
determining whether the impairment is other-than-temporary.
For those debt securities where we do not intend to sell and
believe we will not be required to sell the securities prior to
expected recovery, we recognize the credit portion of OTTI
charges in current earnings and the noncredit portion of OTTI
is included in Accumulated other comprehensive income
(loss). Also see our Consolidated Statement of Comprehensive
Income in Item 8 of this Report.
The PNC Financial Services Group, Inc. – Form 10-K 47