PNC Bank 2012 Annual Report Download - page 189
Download and view the complete annual report
Please find page 189 of the 2012 PNC Bank annual report below. You can navigate through the pages in the report by either clicking on the pages listed below, or by using the keyword search tool below to find specific information within the annual report.-
 1
1 -
2
-
3
-
4
-
5
-
6
-
7
-
8
-
9
-
10
-
11
-
12
-
13
-
14
-
15
-
16
-
17
-
18
-
19
-
20
-
21
-
22
-
23
-
24
-
25
-
26
-
27
-
28
-
29
-
30
-
31
-
32
-
33
-
34
-
35
-
36
-
37
-
38
-
39
-
40
-
41
-
42
-
43
-
44
-
45
-
46
-
47
-
48
-
49
-
50
-
51
-
52
-
53
-
54
-
55
-
56
-
57
-
58
-
59
-
60
-
61
-
62
-
63
-
64
-
65
-
66
-
67
-
68
-
69
-
70
-
71
-
72
-
73
-
74
-
75
-
76
-
77
-
78
-
79
-
80
-
81
-
82
-
83
-
84
-
85
-
86
-
87
-
88
-
89
-
90
-
91
-
92
-
93
-
94
-
95
-
96
-
97
-
98
-
99
-
100
-
101
-
102
-
103
-
104
-
105
-
106
-
107
-
108
-
109
-
110
-
111
-
112
-
113
-
114
-
115
-
116
-
117
-
118
-
119
-
120
-
121
-
122
-
123
-
124
-
125
-
126
-
127
-
128
-
129
-
130
-
131
-
132
-
133
-
134
-
135
-
136
-
137
-
138
-
139
-
140
-
141
-
142
-
143
-
144
-
145
-
146
-
147
-
148
-
149
-
150
-
151
-
152
-
153
-
154
-
155
-
156
-
157
-
158
-
159
-
160
-
161
-
162
-
163
-
164
-
165
-
166
-
167
-
168
-
169
-
170
-
171
-
172
-
173
-
174
-
175
-
176
-
177
-
178
-
 179
179 -
 180
180 -
 181
181 -
 182
182 -
 183
183 -
 184
184 -
 185
185 -
 186
186 -
 187
187 -
 188
188 -
 189
189 -
 190
190 -
 191
191 -
 192
192 -
 193
193 -
 194
194 -
 195
195 -
 196
196 -
 197
197 -
 198
198 -
 199
199 -
200
-
201
-
202
-
203
-
204
-
205
-
206
-
207
-
208
-
209
-
210
-
211
-
212
-
213
-
214
-
215
-
216
-
217
-
218
-
219
-
220
-
221
-
222
-
223
-
224
-
225
-
226
-
227
-
228
-
229
-
230
-
231
-
232
-
233
-
234
-
235
-
236
-
237
-
238
-
239
-
240
-
241
-
242
-
243
-
244
-
245
-
246
-
247
-
248
-
249
-
250
-
251
-
252
-
253
-
254
-
255
-
256
-
257
-
258
-
259
-
260
-
261
-
262
-
263
-
264
-
265
-
266
-
267
-
268
-
269
-
270
-
271
-
272
-
273
-
274
-
275
-
276
-
277
-
278
-
279
-
280
 |
 |

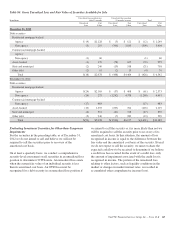
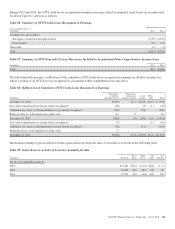
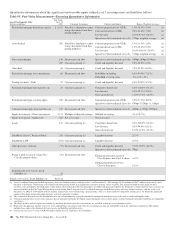
The following table presents, by remaining contractual maturity, the amortized cost, fair value and weighted-average yield of debt
securities at December 31, 2012.
Table 90: Contractual Maturity of Debt Securities
December 31, 2012
Dollars in millions 1 Year or Less
After 1 Year
through 5 Years
After 5 Years
through 10 Years After 10 Years Total
Securities Available for Sale
US Treasury and government agencies $ 2 $1,096 $1,321 $ 449 $ 2,868
Residential mortgage-backed
Agency 22 488 25,334 25,844
Non-agency 2 17 6,083 6,102
Commercial mortgage-backed
Agency 1 550 51 602
Non-agency 174 106 2,775 3,055
Asset-backed 1,063 1,511 3,093 5,667
State and municipal 24 51 447 1,675 2,197
Other debt 390 1,389 575 391 2,745
Total debt securities available for sale $ 417 $4,347 $4,516 $39,800 $49,080
Fair value $ 420 $4,490 $4,729 $41,046 $50,685
Weighted-average yield, GAAP basis 2.83% 2.57% 2.44% 3.37% 3.21%
Securities Held to Maturity
US Treasury and government agencies $ 230 $ 230
Residential mortgage-backed (agency) 4,380 4,380
Commercial mortgage-backed
Agency $ 318 $ 964 5 1,287
Non-agency $ 1 53 2,528 2,582
Asset-backed 124 64 670 858
State and municipal 25 25 279 335 664
Other debt 1 352 353
Total debt securities held to maturity $ 26 $ 521 $1,659 $ 8,148 $10,354
Fair value $ 26 $ 538 $1,777 $ 8,519 $10,860
Weighted-average yield, GAAP basis 1.73% 3.39% 3.44% 4.03% 3.90%
170 The PNC Financial Services Group, Inc. – Form 10-K