PNC Bank 2012 Annual Report Download - page 96
Download and view the complete annual report
Please find page 96 of the 2012 PNC Bank annual report below. You can navigate through the pages in the report by either clicking on the pages listed below, or by using the keyword search tool below to find specific information within the annual report.-
 1
1 -
2
-
3
-
4
-
5
-
6
-
7
-
8
-
9
-
10
-
11
-
12
-
13
-
14
-
15
-
16
-
17
-
18
-
19
-
20
-
21
-
22
-
23
-
24
-
25
-
26
-
27
-
28
-
29
-
30
-
31
-
32
-
33
-
34
-
35
-
36
-
37
-
38
-
39
-
40
-
41
-
42
-
43
-
44
-
45
-
46
-
47
-
48
-
49
-
50
-
51
-
52
-
53
-
54
-
55
-
56
-
57
-
58
-
59
-
60
-
61
-
62
-
63
-
64
-
65
-
66
-
67
-
68
-
69
-
70
-
71
-
72
-
73
-
74
-
75
-
76
-
77
-
78
-
79
-
80
-
81
-
82
-
83
-
84
-
85
-
 86
86 -
 87
87 -
 88
88 -
 89
89 -
 90
90 -
 91
91 -
 92
92 -
 93
93 -
 94
94 -
 95
95 -
 96
96 -
 97
97 -
 98
98 -
 99
99 -
 100
100 -
 101
101 -
 102
102 -
 103
103 -
 104
104 -
 105
105 -
 106
106 -
107
-
108
-
109
-
110
-
111
-
112
-
113
-
114
-
115
-
116
-
117
-
118
-
119
-
120
-
121
-
122
-
123
-
124
-
125
-
126
-
127
-
128
-
129
-
130
-
131
-
132
-
133
-
134
-
135
-
136
-
137
-
138
-
139
-
140
-
141
-
142
-
143
-
144
-
145
-
146
-
147
-
148
-
149
-
150
-
151
-
152
-
153
-
154
-
155
-
156
-
157
-
158
-
159
-
160
-
161
-
162
-
163
-
164
-
165
-
166
-
167
-
168
-
169
-
170
-
171
-
172
-
173
-
174
-
175
-
176
-
177
-
178
-
179
-
180
-
181
-
182
-
183
-
184
-
185
-
186
-
187
-
188
-
189
-
190
-
191
-
192
-
193
-
194
-
195
-
196
-
197
-
198
-
199
-
200
-
201
-
202
-
203
-
204
-
205
-
206
-
207
-
208
-
209
-
210
-
211
-
212
-
213
-
214
-
215
-
216
-
217
-
218
-
219
-
220
-
221
-
222
-
223
-
224
-
225
-
226
-
227
-
228
-
229
-
230
-
231
-
232
-
233
-
234
-
235
-
236
-
237
-
238
-
239
-
240
-
241
-
242
-
243
-
244
-
245
-
246
-
247
-
248
-
249
-
250
-
251
-
252
-
253
-
254
-
255
-
256
-
257
-
258
-
259
-
260
-
261
-
262
-
263
-
264
-
265
-
266
-
267
-
268
-
269
-
270
-
271
-
272
-
273
-
274
-
275
-
276
-
277
-
278
-
279
-
280
 |
 |

securities have historically returned approximately 10%
annually over long periods of time, while U.S. debt securities
have returned approximately 6% annually over long periods.
Application of these historical returns to the plan’s allocation
ranges for equities and bonds produces a result between 7.25%
and 8.75% and is one point of reference, among many other
factors, that is taken into consideration. We also examine the
plan’s actual historical returns over various periods and
consider the current economic environment. Recent
experience is considered in our evaluation with appropriate
consideration that, especially for short time periods, recent
returns are not reliable indicators of future returns. While
annual returns can vary significantly (actual returns for 2012,
2011, and 2010 were +15.29%, +.11%, and +14.87%,
respectively), the selected assumption represents our estimated
long-term average prospective returns.
Acknowledging the potentially wide range for this
assumption, we also annually examine the assumption used by
other companies with similar pension investment strategies, so
that we can ascertain whether our determinations markedly
differ from others. In all cases, however, this data simply
informs our process, which places the greatest emphasis on
our qualitative judgment of future investment returns, given
the conditions existing at each annual measurement date.
Taking into consideration all of these factors, the expected
long-term return on plan assets for determining net periodic
pension cost for 2012 was 7.75%, the same as it was for 2011.
After considering the views of both internal and external
capital market advisors, particularly with regard to the effects
of the recent economic environment on long-term prospective
fixed income returns, we are reducing our expected long-term
return on assets to 7.50% for determining pension cost for
2013.
Under current accounting rules, the difference between
expected long-term returns and actual returns is accumulated
and amortized to pension expense over future periods. Each
one percentage point difference in actual return compared
with our expected return causes expense in subsequent years
to increase or decrease by up to $8 million as the impact is
amortized into results of operations.
We currently estimate a pretax pension expense of $73 million
in 2013 compared with pretax expense of $89 million in 2012.
This year-over-year expected decrease reflects the impact of
favorable returns on plan assets experienced in 2012 as well as
the effects of the lower discount rate required to be used in
2013.
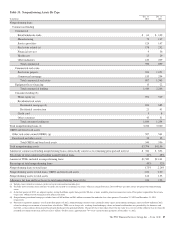
The table below reflects the estimated effects on pension
expense of certain changes in annual assumptions, using 2013
estimated expense as a baseline.
Table 27: Pension Expense - Sensitivity Analysis
Change in Assumption (a)
Estimated
Increase to 2013
Pension
Expense
(In millions)
.5% decrease in discount rate $21
.5% decrease in expected long-term return on assets $19
.5% increase in compensation rate $ 2
(a) The impact is the effect of changing the specified assumption while holding all other
assumptions constant.
Our pension plan contribution requirements are not
particularly sensitive to actuarial assumptions. Investment
performance has the most impact on contribution requirements
and will drive the amount of required contributions in future
years. Also, current law, including the provisions of the
Pension Protection Act of 2006, sets limits as to both
minimum and maximum contributions to the plan. We do not
expect to be required by law to make any contributions to the
plan during 2013.
We maintain other defined benefit plans that have a less
significant effect on financial results, including various
nonqualified supplemental retirement plans for certain
employees, which are described more fully in Note 15
Employee Benefit Plans in the Notes To Consolidated
Financial Statements in Item 8 of this Report.
The PNC Financial Services Group, Inc. – Form 10-K 77