PNC Bank 2012 Annual Report Download - page 78
Download and view the complete annual report
Please find page 78 of the 2012 PNC Bank annual report below. You can navigate through the pages in the report by either clicking on the pages listed below, or by using the keyword search tool below to find specific information within the annual report.-
 1
1 -
2
-
3
-
4
-
5
-
6
-
7
-
8
-
9
-
10
-
11
-
12
-
13
-
14
-
15
-
16
-
17
-
18
-
19
-
20
-
21
-
22
-
23
-
24
-
25
-
26
-
27
-
28
-
29
-
30
-
31
-
32
-
33
-
34
-
35
-
36
-
37
-
38
-
39
-
40
-
41
-
42
-
43
-
44
-
45
-
46
-
47
-
48
-
49
-
50
-
51
-
52
-
53
-
54
-
55
-
56
-
57
-
58
-
59
-
60
-
61
-
62
-
63
-
64
-
65
-
66
-
67
-
 68
68 -
 69
69 -
 70
70 -
 71
71 -
 72
72 -
 73
73 -
 74
74 -
 75
75 -
 76
76 -
 77
77 -
 78
78 -
 79
79 -
 80
80 -
 81
81 -
 82
82 -
 83
83 -
 84
84 -
 85
85 -
 86
86 -
 87
87 -
 88
88 -
89
-
90
-
91
-
92
-
93
-
94
-
95
-
96
-
97
-
98
-
99
-
100
-
101
-
102
-
103
-
104
-
105
-
106
-
107
-
108
-
109
-
110
-
111
-
112
-
113
-
114
-
115
-
116
-
117
-
118
-
119
-
120
-
121
-
122
-
123
-
124
-
125
-
126
-
127
-
128
-
129
-
130
-
131
-
132
-
133
-
134
-
135
-
136
-
137
-
138
-
139
-
140
-
141
-
142
-
143
-
144
-
145
-
146
-
147
-
148
-
149
-
150
-
151
-
152
-
153
-
154
-
155
-
156
-
157
-
158
-
159
-
160
-
161
-
162
-
163
-
164
-
165
-
166
-
167
-
168
-
169
-
170
-
171
-
172
-
173
-
174
-
175
-
176
-
177
-
178
-
179
-
180
-
181
-
182
-
183
-
184
-
185
-
186
-
187
-
188
-
189
-
190
-
191
-
192
-
193
-
194
-
195
-
196
-
197
-
198
-
199
-
200
-
201
-
202
-
203
-
204
-
205
-
206
-
207
-
208
-
209
-
210
-
211
-
212
-
213
-
214
-
215
-
216
-
217
-
218
-
219
-
220
-
221
-
222
-
223
-
224
-
225
-
226
-
227
-
228
-
229
-
230
-
231
-
232
-
233
-
234
-
235
-
236
-
237
-
238
-
239
-
240
-
241
-
242
-
243
-
244
-
245
-
246
-
247
-
248
-
249
-
250
-
251
-
252
-
253
-
254
-
255
-
256
-
257
-
258
-
259
-
260
-
261
-
262
-
263
-
264
-
265
-
266
-
267
-
268
-
269
-
270
-
271
-
272
-
273
-
274
-
275
-
276
-
277
-
278
-
279
-
280
 |
 |

R
ETAIL
B
ANKING
(Unaudited)
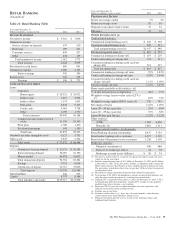
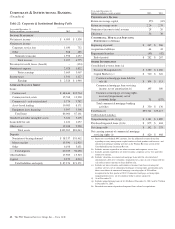
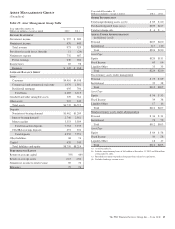
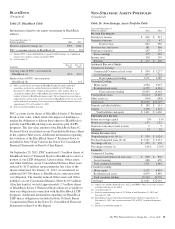
Table 21: Retail Banking Table
Year ended December 31
Dollars in millions, except as noted 2012 2011
I
NCOME
S
TATEMENT
Net interest income $ 4,316 $ 3,806
Noninterest income
Service charges on deposits 547 510
Brokerage 189 201
Consumer services 838 927
Other 438 135
Total noninterest income 2,012 1,773
Total revenue 6,328 5,579
Provision for credit losses 800 891
Noninterest expense 4,586 4,103
Pretax earnings 942 585
Income taxes 346 214
Earnings $ 596 $ 371
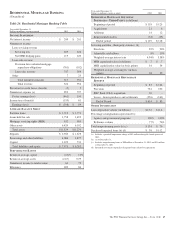
A
VERAGE
B
ALANCE
S
HEET
Loans
Consumer
Home equity $ 28,321 $ 25,972
Indirect auto 5,467 3,094
Indirect other 1,174 1,491
Education 8,878 9,103
Credit cards 4,063 3,738
Other 2,039 1,750
Total consumer 49,942 45,148
Commercial and commercial real
estate 11,198 10,567
Floor plan 1,788 1,450
Residential mortgage 946 1,180
Total loans 63,874 58,345
Goodwill and other intangible assets 6,123 5,751
Other assets 2,576 2,352
Total assets $ 72,573 $ 66,448
Deposits
Noninterest-bearing demand $ 20,179 $ 18,183
Interest-bearing demand 28,007 22,196
Money market 46,578 41,002
Total transaction deposits 94,764 81,381
Savings 9,751 8,098
Certificates of deposit 25,715 33,006
Total deposits 130,230 122,485
Other liabilities 340 855
Capital 8,747 8,168
Total liabilities and equity $139,317 $131,508
Year ended December 31
Dollars in millions, except as noted 2012 2011
P
ERFORMANCE
R
ATIOS
Return on average capital 7% 5%
Return on average assets .82 .56
Noninterest income to total revenue 32 32
Efficiency 72 74
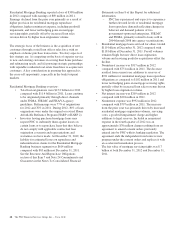
O
THER
I
NFORMATION
(a)
Credit-related statistics:
Commercial nonperforming assets $ 245 $ 336
Consumer nonperforming assets 902 513
Total nonperforming assets (b) $1,147 $ 849
Purchased impaired loans (c) $ 819 $ 757
Commercial lending net charge-offs $ 119 $ 219
Credit card lending net charge-offs 174 211
Consumer lending (excluding credit card) net
charge-offs 521 427
Total net charge-offs $ 814 $ 857
Commercial lending net charge-off ratio .92% 1.82%
Credit card lending net charge-off ratio 4.28% 5.64%
Consumer lending (excluding credit card) net
charge-off ratio 1.11% 1.00%
Total net charge-off ratio 1.27% 1.47%
Home equity portfolio credit statistics: (d)
% of first lien positions at origination 42% 39%
Weighted-average loan-to-value ratios (LTVs)
(e) 81% 72%
Weighted-average updated FICO scores (f) 742 743
Net charge-off ratio 1.22% 1.09%
Loans 30 – 59 days past due .52% .58%
Loans 60 – 89 days past due .33% .38%
Loans 90 days past due (g) 1.22% 1.22%
Other statistics:
ATMs 7,282 6,806
Branches (h) 2,881 2,511
Customer-related statistics: (in thousands)
Retail Banking checking relationships 6,475 5,761
Retail online banking active customers 4,227 3,519
Retail online bill payment active customers 1,236 1,105
Brokerage statistics:
Financial consultants (i) 636 686
Full service brokerage offices 41 38
Brokerage account assets (billions) $ 38 $ 34
(a) Presented as of December 31, except for net charge-offs and net charge-off ratios,
which are for the year ended.
(b) Includes nonperforming loans of $1.1 billion at December 31, 2012 and $.8 billion
at December 31, 2011. In the first quarter of 2012, we adopted a policy stating that
Home equity loans past due 90 days or more would be placed on nonaccrual status.
The prior policy required that these loans be past due 180 days before being placed
on nonaccrual status.
(c) Recorded investment of purchased impaired loans related to acquisitions.
(d) Lien position, LTV, FICO and delinquency statistics are based upon balances and
other data that exclude the impact of accounting for acquired loans.
(e) Updated LTV is reported for December 31, 2012. For December 31, 2011, LTV is
based upon data from loan origination. Original LTV excludes certain acquired
portfolio loans where this data is not available.
(f) Represents FICO scores that are updated monthly for home equity lines and
quarterly for the home equity installment loans.
(g) Includes non-accrual loans.
(h) Excludes satellite offices (e.g., drive-ups, electronic branches, and retirement
centers) that provide limited products and/or services.
(i) Financial consultants provide services in full service brokerage offices and
traditional bank branches.
The PNC Financial Services Group, Inc. – Form 10-K 59