PNC Bank 2012 Annual Report Download - page 204
Download and view the complete annual report
Please find page 204 of the 2012 PNC Bank annual report below. You can navigate through the pages in the report by either clicking on the pages listed below, or by using the keyword search tool below to find specific information within the annual report.-
 1
1 -
2
-
3
-
4
-
5
-
6
-
7
-
8
-
9
-
10
-
11
-
12
-
13
-
14
-
15
-
16
-
17
-
18
-
19
-
20
-
21
-
22
-
23
-
24
-
25
-
26
-
27
-
28
-
29
-
30
-
31
-
32
-
33
-
34
-
35
-
36
-
37
-
38
-
39
-
40
-
41
-
42
-
43
-
44
-
45
-
46
-
47
-
48
-
49
-
50
-
51
-
52
-
53
-
54
-
55
-
56
-
57
-
58
-
59
-
60
-
61
-
62
-
63
-
64
-
65
-
66
-
67
-
68
-
69
-
70
-
71
-
72
-
73
-
74
-
75
-
76
-
77
-
78
-
79
-
80
-
81
-
82
-
83
-
84
-
85
-
86
-
87
-
88
-
89
-
90
-
91
-
92
-
93
-
94
-
95
-
96
-
97
-
98
-
99
-
100
-
101
-
102
-
103
-
104
-
105
-
106
-
107
-
108
-
109
-
110
-
111
-
112
-
113
-
114
-
115
-
116
-
117
-
118
-
119
-
120
-
121
-
122
-
123
-
124
-
125
-
126
-
127
-
128
-
129
-
130
-
131
-
132
-
133
-
134
-
135
-
136
-
137
-
138
-
139
-
140
-
141
-
142
-
143
-
144
-
145
-
146
-
147
-
148
-
149
-
150
-
151
-
152
-
153
-
154
-
155
-
156
-
157
-
158
-
159
-
160
-
161
-
162
-
163
-
164
-
165
-
166
-
167
-
168
-
169
-
170
-
171
-
172
-
173
-
174
-
175
-
176
-
177
-
178
-
179
-
180
-
181
-
182
-
183
-
184
-
185
-
186
-
187
-
188
-
189
-
190
-
191
-
192
-
193
-
 194
194 -
 195
195 -
 196
196 -
 197
197 -
 198
198 -
 199
199 -
 200
200 -
 201
201 -
 202
202 -
 203
203 -
 204
204 -
 205
205 -
 206
206 -
 207
207 -
 208
208 -
 209
209 -
 210
210 -
 211
211 -
 212
212 -
 213
213 -
 214
214 -
215
-
216
-
217
-
218
-
219
-
220
-
221
-
222
-
223
-
224
-
225
-
226
-
227
-
228
-
229
-
230
-
231
-
232
-
233
-
234
-
235
-
236
-
237
-
238
-
239
-
240
-
241
-
242
-
243
-
244
-
245
-
246
-
247
-
248
-
249
-
250
-
251
-
252
-
253
-
254
-
255
-
256
-
257
-
258
-
259
-
260
-
261
-
262
-
263
-
264
-
265
-
266
-
267
-
268
-
269
-
270
-
271
-
272
-
273
-
274
-
275
-
276
-
277
-
278
-
279
-
280
 |
 |

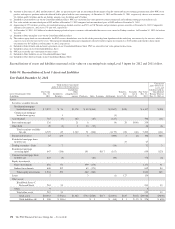
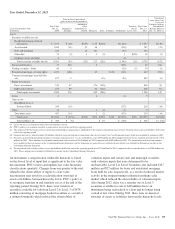
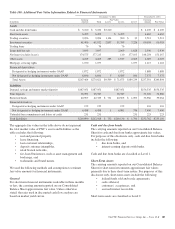
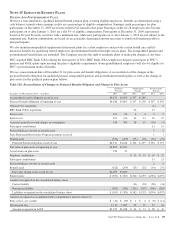
Table 100: Additional Fair Value Information Related to Financial Instruments
December 31, 2012 December 31, 2011
Carrying Fair Value Carrying
In millions Amount Total Level 1 Level 2 Level 3 Amount Fair Value
Assets
Cash and due from banks $ 5,220 $ 5,220 $5,220 $ 4,105 $ 4,105
Short-term assets 6,495 6,495 $ 6,495 4,462 4,462
Trading securities 2,096 2,096 1,104 960 $ 32 2,513 2,513
Investment securities 61,406 61,912 2,897 51,789 7,226 60,634 61,018
Trading loans 76 76 76
Loans held for sale 3,693 3,697 2,069 1,628 2,936 2,939
Net loans (excludes leases) 174,575 177,215 110 177,105 148,254 151,167
Other assets 4,265 4,265 283 1,917 2,065 4,019 4,019
Mortgage servicing rights 1,070 1,077 1,077 1,115 1,118
Financial derivatives
Designated as hedging instruments under GAAP 1,872 1,872 1,872 1,888 1,888
Not designated as hedging instruments under GAAP 6,696 6,696 5 6,585 106 7,575 7,575
Total Assets $267,464 $270,621 $9,509 $ 71,873 $189,239 $237,501 $240,804
Liabilities
Demand, savings and money market deposits $187,051 $187,051 $187,051 $156,335 $156,335
Time deposits 26,091 26,347 26,347 31,632 31,882
Borrowed funds 40,907 42,329 $ 731 40,505 $ 1,093 36,966 39,064
Financial derivatives
Designated as hedging instruments under GAAP 152 152 152 116 116
Not designated as hedging instruments under GAAP 6,458 6,458 1 6,081 376 7,490 7,490
Unfunded loan commitments and letters of credit 231 231 231 223 223
Total Liabilities $260,890 $262,568 $ 732 $260,136 $ 1,700 $232,762 $235,110
The aggregate fair values in the table above do not represent
the total market value of PNC’s assets and liabilities as the
table excludes the following:
• real and personal property,
• lease financing,
• loan customer relationships,
• deposit customer intangibles,
• retail branch networks,
• fee-based businesses, such as asset management and
brokerage, and
• trademarks and brand names.
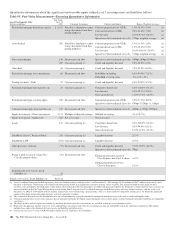
We used the following methods and assumptions to estimate
fair value amounts for financial instruments.
General
For short-term financial instruments realizable in three months
or less, the carrying amount reported on our Consolidated
Balance Sheet approximates fair value. Unless otherwise
stated, the rates used in discounted cash flow analyses are
based on market yield curves.
Cash and due from banks
The carrying amounts reported on our Consolidated Balance
Sheet for cash and due from banks approximate fair values.
For purposes of this disclosure only, cash and due from banks
includes the following:
• due from banks, and
• interest-earning deposits with banks.
Cash and due from banks are classified as Level 1.
Short-Term Assets
The carrying amounts reported on our Consolidated Balance
Sheet for short-term investments approximate fair values
primarily due to their short-term nature. For purposes of this
disclosure only, short-term assets include the following:
• federal funds sold and resale agreements,
• cash collateral,
• customers’ acceptances, and
• accrued interest receivable.
Short-term assets are classified as Level 2.
The PNC Financial Services Group, Inc. – Form 10-K 185