PNC Bank 2012 Annual Report Download - page 185
Download and view the complete annual report
Please find page 185 of the 2012 PNC Bank annual report below. You can navigate through the pages in the report by either clicking on the pages listed below, or by using the keyword search tool below to find specific information within the annual report.-
 1
1 -
2
-
3
-
4
-
5
-
6
-
7
-
8
-
9
-
10
-
11
-
12
-
13
-
14
-
15
-
16
-
17
-
18
-
19
-
20
-
21
-
22
-
23
-
24
-
25
-
26
-
27
-
28
-
29
-
30
-
31
-
32
-
33
-
34
-
35
-
36
-
37
-
38
-
39
-
40
-
41
-
42
-
43
-
44
-
45
-
46
-
47
-
48
-
49
-
50
-
51
-
52
-
53
-
54
-
55
-
56
-
57
-
58
-
59
-
60
-
61
-
62
-
63
-
64
-
65
-
66
-
67
-
68
-
69
-
70
-
71
-
72
-
73
-
74
-
75
-
76
-
77
-
78
-
79
-
80
-
81
-
82
-
83
-
84
-
85
-
86
-
87
-
88
-
89
-
90
-
91
-
92
-
93
-
94
-
95
-
96
-
97
-
98
-
99
-
100
-
101
-
102
-
103
-
104
-
105
-
106
-
107
-
108
-
109
-
110
-
111
-
112
-
113
-
114
-
115
-
116
-
117
-
118
-
119
-
120
-
121
-
122
-
123
-
124
-
125
-
126
-
127
-
128
-
129
-
130
-
131
-
132
-
133
-
134
-
135
-
136
-
137
-
138
-
139
-
140
-
141
-
142
-
143
-
144
-
145
-
146
-
147
-
148
-
149
-
150
-
151
-
152
-
153
-
154
-
155
-
156
-
157
-
158
-
159
-
160
-
161
-
162
-
163
-
164
-
165
-
166
-
167
-
168
-
169
-
170
-
171
-
172
-
173
-
174
-
 175
175 -
 176
176 -
 177
177 -
 178
178 -
 179
179 -
 180
180 -
 181
181 -
 182
182 -
 183
183 -
 184
184 -
 185
185 -
 186
186 -
 187
187 -
 188
188 -
 189
189 -
 190
190 -
 191
191 -
 192
192 -
 193
193 -
 194
194 -
 195
195 -
196
-
197
-
198
-
199
-
200
-
201
-
202
-
203
-
204
-
205
-
206
-
207
-
208
-
209
-
210
-
211
-
212
-
213
-
214
-
215
-
216
-
217
-
218
-
219
-
220
-
221
-
222
-
223
-
224
-
225
-
226
-
227
-
228
-
229
-
230
-
231
-
232
-
233
-
234
-
235
-
236
-
237
-
238
-
239
-
240
-
241
-
242
-
243
-
244
-
245
-
246
-
247
-
248
-
249
-
250
-
251
-
252
-
253
-
254
-
255
-
256
-
257
-
258
-
259
-
260
-
261
-
262
-
263
-
264
-
265
-
266
-
267
-
268
-
269
-
270
-
271
-
272
-
273
-
274
-
275
-
276
-
277
-
278
-
279
-
280
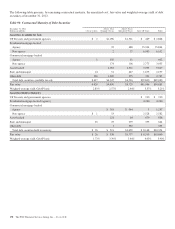
 |
 |

Amortized
Cost
Unrealized Fair
ValueIn millions Gains Losses
December 31, 2010
S
ECURITIES
A
VAILABLE FOR
S
ALE
Debt securities
US Treasury and government agencies $ 5,575 $ 157 $ (22) $ 5,710
Residential mortgage-backed
Agency 31,697 443 (420) 31,720
Non-agency 8,193 230 (1,190) 7,233
Commercial mortgage-backed
Agency 1,763 40 (6) 1,797
Non-agency 1,794 73 (11) 1,856
Asset-backed 2,780 40 (238) 2,582
State and municipal 1,999 30 (72) 1,957
Other debt 3,992 102 (17) 4,077
Total debt securities 57,793 1,115 (1,976) 56,932
Corporate stocks and other 378 378
Total securities available for sale $58,171 $1,115 $(1,976) $57,310
S
ECURITIES
H
ELD TO
M
ATURITY
Debt securities
Commercial mortgage-backed (non-agency) $ 4,316 $ 178 $ (4) $ 4,490
Asset-backed 2,626 51 (1) 2,676
Other debt 10 1 11
Total securities held to maturity $ 6,952 $ 230 $ (5) $ 7,177
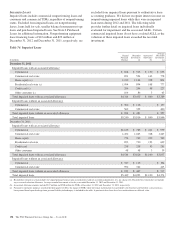
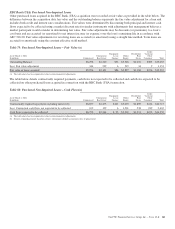
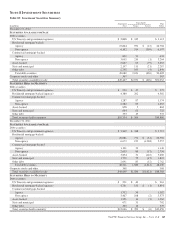
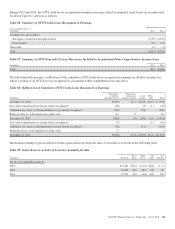
The fair value of investment securities is impacted by interest
rates, credit spreads, market volatility and liquidity conditions.
Net unrealized gains and losses in the securities available for
sale portfolio are included in shareholders’ equity as
accumulated other comprehensive income or loss, net of tax,
unless credit-related. Securities held to maturity are carried at
amortized cost. At December 31, 2012, accumulated other
comprehensive income included pretax gains of $89 million
from derivatives used to hedge the purchase of investment
securities classified as held to maturity. The gains will be
accreted into interest income as an adjustment of yield on the
securities.
During 2011, we transferred securities with a fair value of
$6.3 billion from available for sale to held to maturity. The
securities were reclassified at fair value at the time of transfer
and represented a non-cash transaction. Accumulated other
comprehensive income included net pretax unrealized gains of
$183 million on the securities at transfer, which are being
accreted over the remaining life of the related securities as an
adjustment of yield in a manner consistent with the
amortization of the net premium on the same transferred
securities, resulting in no impact on net income. The transfers
were completed in order to reduce the impact of price
volatility on accumulated other comprehensive income and
certain capital measures, and considered potential changes to
regulatory capital requirements under the proposed Basel III
capital standards.
The gross unrealized loss on debt securities held to maturity
was less than $1 million at December 31, 2012 and $6 million
at December 31, 2011, with $73 million and $522 million of
positions in a continuous loss position for less than 12 months
at December 31, 2012 and December 31, 2011, respectively.
The fair value on debt securities held to maturity that were in
a continuous loss position for 12 months or more was $56
million and $85 million at December 31, 2012 and
December 31, 2011, respectively.
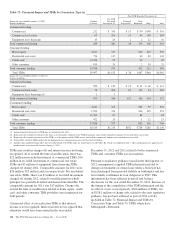
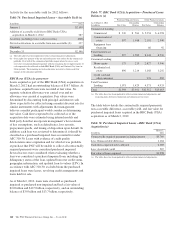
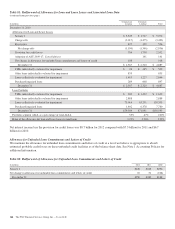
The following table presents gross unrealized loss and fair
value of securities available for sale at December 31, 2012 and
December 31, 2011. The securities are segregated between
investments that have been in a continuous unrealized loss
position for less than twelve months and twelve months or
more based on the point in time the fair value declined below
the amortized cost basis. The table includes debt securities
where a portion of other-than-temporary impairment (OTTI)
has been recognized in accumulated other comprehensive
income (loss).
166 The PNC Financial Services Group, Inc. – Form 10-K