PNC Bank 2012 Annual Report Download - page 124
Download and view the complete annual report
Please find page 124 of the 2012 PNC Bank annual report below. You can navigate through the pages in the report by either clicking on the pages listed below, or by using the keyword search tool below to find specific information within the annual report.-
 1
1 -
2
-
3
-
4
-
5
-
6
-
7
-
8
-
9
-
10
-
11
-
12
-
13
-
14
-
15
-
16
-
17
-
18
-
19
-
20
-
21
-
22
-
23
-
24
-
25
-
26
-
27
-
28
-
29
-
30
-
31
-
32
-
33
-
34
-
35
-
36
-
37
-
38
-
39
-
40
-
41
-
42
-
43
-
44
-
45
-
46
-
47
-
48
-
49
-
50
-
51
-
52
-
53
-
54
-
55
-
56
-
57
-
58
-
59
-
60
-
61
-
62
-
63
-
64
-
65
-
66
-
67
-
68
-
69
-
70
-
71
-
72
-
73
-
74
-
75
-
76
-
77
-
78
-
79
-
80
-
81
-
82
-
83
-
84
-
85
-
86
-
87
-
88
-
89
-
90
-
91
-
92
-
93
-
94
-
95
-
96
-
97
-
98
-
99
-
100
-
101
-
102
-
103
-
104
-
105
-
106
-
107
-
108
-
109
-
110
-
111
-
112
-
113
-
 114
114 -
 115
115 -
 116
116 -
 117
117 -
 118
118 -
 119
119 -
 120
120 -
 121
121 -
 122
122 -
 123
123 -
 124
124 -
 125
125 -
 126
126 -
 127
127 -
 128
128 -
 129
129 -
 130
130 -
 131
131 -
 132
132 -
 133
133 -
 134
134 -
135
-
136
-
137
-
138
-
139
-
140
-
141
-
142
-
143
-
144
-
145
-
146
-
147
-
148
-
149
-
150
-
151
-
152
-
153
-
154
-
155
-
156
-
157
-
158
-
159
-
160
-
161
-
162
-
163
-
164
-
165
-
166
-
167
-
168
-
169
-
170
-
171
-
172
-
173
-
174
-
175
-
176
-
177
-
178
-
179
-
180
-
181
-
182
-
183
-
184
-
185
-
186
-
187
-
188
-
189
-
190
-
191
-
192
-
193
-
194
-
195
-
196
-
197
-
198
-
199
-
200
-
201
-
202
-
203
-
204
-
205
-
206
-
207
-
208
-
209
-
210
-
211
-
212
-
213
-
214
-
215
-
216
-
217
-
218
-
219
-
220
-
221
-
222
-
223
-
224
-
225
-
226
-
227
-
228
-
229
-
230
-
231
-
232
-
233
-
234
-
235
-
236
-
237
-
238
-
239
-
240
-
241
-
242
-
243
-
244
-
245
-
246
-
247
-
248
-
249
-
250
-
251
-
252
-
253
-
254
-
255
-
256
-
257
-
258
-
259
-
260
-
261
-
262
-
263
-
264
-
265
-
266
-
267
-
268
-
269
-
270
-
271
-
272
-
273
-
274
-
275
-
276
-
277
-
278
-
279
-
280
 |
 |
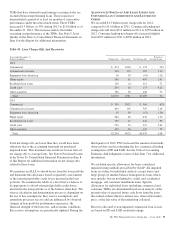
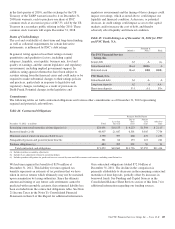
In addition to measuring the effect on net interest income
assuming parallel changes in current interest rates, we
routinely simulate the effects of a number of nonparallel
interest rate environments. The following Net Interest Income
Sensitivity to Alternative Rate Scenarios (Fourth Quarter
2012) table reflects the percentage change in net interest
income over the next two 12-month periods assuming (i) the
PNC Economist’s most likely rate forecast, (ii) implied market
forward rates, and (iii) Yield Curve Slope Flattening (a 100
basis point yield curve slope flattening between 1-month and
ten-year rates superimposed on current base rates) scenario.
Table 49: Net Interest Income Sensitivity to Alternative Rate
Scenarios (Fourth Quarter 2012)
PNC
Economist
Market
Forward
Slope
Flattening
First year sensitivity .03% .50% (1.03)%
Second year sensitivity 1.44% 2.12% (3.92)%
All changes in forecasted net interest income are relative to
results in a base rate scenario where current market rates are
assumed to remain unchanged over the forecast horizon.
When forecasting net interest income, we make assumptions
about interest rates and the shape of the yield curve, the
volume and characteristics of new business, and the behavior
of existing on- and off-balance sheet positions. These
assumptions determine the future level of simulated net
interest income in the base interest rate scenario and the other
interest rate scenarios presented in the above table. These
simulations assume that as assets and liabilities mature, they
are replaced or repriced at then current market rates. We also
consider forward projections of purchase accounting accretion
when forecasting net interest income.
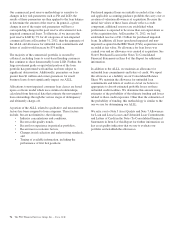
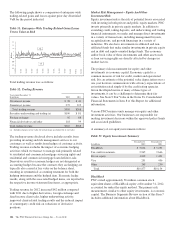
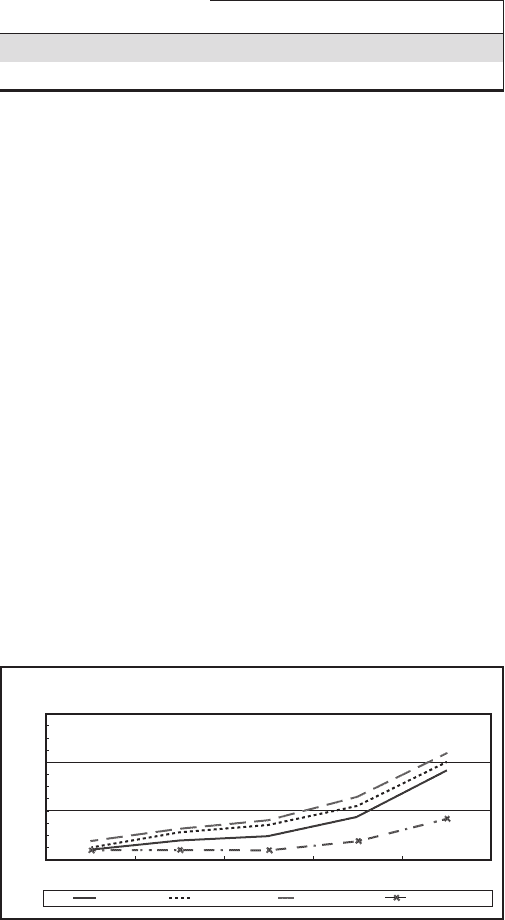
The following graph presents the LIBOR/Swap yield curves
for the base rate scenario and each of the alternate scenarios
one year forward.
Table 50: Alternate Interest Rate Scenarios: One Year
Forward
1M
Interest Rate
0.0
Base Rates PNC Economist Market Forward Slope Flattening
1.0
2.0
3.0
2Y 3Y 5Y 10Y
The fourth quarter 2012 interest sensitivity analyses indicate
that our Consolidated Balance Sheet is positioned to benefit
from an increase in interest rates and an upward sloping
interest rate yield curve. We believe that we have the deposit
funding base and balance sheet flexibility to adjust, where
appropriate and permissible, to changing interest rates and
market conditions.
Market Risk Management – Trading Risk
Our trading activities are primarily customer-driven trading in
fixed income securities, derivatives and foreign exchange
contracts, as well as the daily mark-to-market impact from the
credit valuation adjustment (CVA) on the customer
derivatives portfolio. They also include the underwriting of
fixed income and equity securities.
We use value-at-risk (VaR) as the primary means to measure
and monitor market risk in trading activities. We calculate a
diversified VaR at a 95% confidence interval. VaR is used to
estimate the probability of portfolio losses based on the
statistical analysis of historical market risk factors. A
diversified VaR reflects empirical correlations across different
asset classes.
PNC began to include the daily mark-to-market impact from
the CVA in determining the diversified VaR measure during
the first quarter of 2012 due to enhancements in our models,
and comparative periods are stated on a similar basis. During
2012, our 95% VaR ranged between $1.1 million and $5.3
million, averaging $3.2 million. During 2011, our 95% VaR
ranged between $.7 million and $4.8 million, averaging $2.4
million.
To help ensure the integrity of the models used to calculate
VaR for each portfolio and enterprise-wide, we use a process
known as backtesting. The backtesting process consists of
comparing actual observations of trading-related gains or
losses against the VaR levels that were calculated at the close
of the prior day. This assumes that market exposures remain
constant throughout the day and that recent historical market
variability is a good predictor of future variability. Our actual
trading related activity includes customer revenue and
intraday hedging which helps to reduce trading losses, and
may reduce the number of instances of actual losses exceeding
the prior day VaR measure. There were two such instances
during both 2012 and 2011 under our diversified VaR
measure. We use a 500 day look back period for backtesting
and include customer related revenue.
The PNC Financial Services Group, Inc. – Form 10-K 105