PNC Bank 2012 Annual Report Download - page 161
Download and view the complete annual report
Please find page 161 of the 2012 PNC Bank annual report below. You can navigate through the pages in the report by either clicking on the pages listed below, or by using the keyword search tool below to find specific information within the annual report.-
 1
1 -
2
-
3
-
4
-
5
-
6
-
7
-
8
-
9
-
10
-
11
-
12
-
13
-
14
-
15
-
16
-
17
-
18
-
19
-
20
-
21
-
22
-
23
-
24
-
25
-
26
-
27
-
28
-
29
-
30
-
31
-
32
-
33
-
34
-
35
-
36
-
37
-
38
-
39
-
40
-
41
-
42
-
43
-
44
-
45
-
46
-
47
-
48
-
49
-
50
-
51
-
52
-
53
-
54
-
55
-
56
-
57
-
58
-
59
-
60
-
61
-
62
-
63
-
64
-
65
-
66
-
67
-
68
-
69
-
70
-
71
-
72
-
73
-
74
-
75
-
76
-
77
-
78
-
79
-
80
-
81
-
82
-
83
-
84
-
85
-
86
-
87
-
88
-
89
-
90
-
91
-
92
-
93
-
94
-
95
-
96
-
97
-
98
-
99
-
100
-
101
-
102
-
103
-
104
-
105
-
106
-
107
-
108
-
109
-
110
-
111
-
112
-
113
-
114
-
115
-
116
-
117
-
118
-
119
-
120
-
121
-
122
-
123
-
124
-
125
-
126
-
127
-
128
-
129
-
130
-
131
-
132
-
133
-
134
-
135
-
136
-
137
-
138
-
139
-
140
-
141
-
142
-
143
-
144
-
145
-
146
-
147
-
148
-
149
-
150
-
 151
151 -
 152
152 -
 153
153 -
 154
154 -
 155
155 -
 156
156 -
 157
157 -
 158
158 -
 159
159 -
 160
160 -
 161
161 -
 162
162 -
 163
163 -
 164
164 -
 165
165 -
 166
166 -
 167
167 -
 168
168 -
 169
169 -
 170
170 -
 171
171 -
172
-
173
-
174
-
175
-
176
-
177
-
178
-
179
-
180
-
181
-
182
-
183
-
184
-
185
-
186
-
187
-
188
-
189
-
190
-
191
-
192
-
193
-
194
-
195
-
196
-
197
-
198
-
199
-
200
-
201
-
202
-
203
-
204
-
205
-
206
-
207
-
208
-
209
-
210
-
211
-
212
-
213
-
214
-
215
-
216
-
217
-
218
-
219
-
220
-
221
-
222
-
223
-
224
-
225
-
226
-
227
-
228
-
229
-
230
-
231
-
232
-
233
-
234
-
235
-
236
-
237
-
238
-
239
-
240
-
241
-
242
-
243
-
244
-
245
-
246
-
247
-
248
-
249
-
250
-
251
-
252
-
253
-
254
-
255
-
256
-
257
-
258
-
259
-
260
-
261
-
262
-
263
-
264
-
265
-
266
-
267
-
268
-
269
-
270
-
271
-
272
-
273
-
274
-
275
-
276
-
277
-
278
-
279
-
280
 |
 |

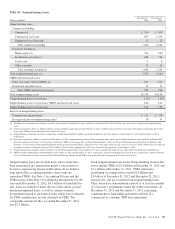
Table 60: Assets and Liabilities of Consolidated VIEs (a)
In millions
Aggregate
Assets
Aggregate
Liabilities
December 31, 2012
Market Street $7,796 $7,796
Credit Card Securitization Trust 1,782
Tax Credit Investments 2,162 853
December 31, 2011
Market Street $5,490 $5,491
Credit Card Securitization Trust 2,175 494
Tax Credit Investments 2,503 723
(a) Amounts in this table differ from total assets and liabilities in the preceding “Consolidated VIEs—Carrying Value” table due to the elimination of intercompany assets and liabilities in
the preceding table.
Table 61: Non-Consolidated VIEs
In millions
Aggregate
Assets
Aggregate
Liabilities
PNC
Risk of
Loss
Carrying
Value of
Assets
Carrying
Value of
Liabilities
December 31, 2012
Commercial Mortgage-Backed Securitizations (a) $ 72,370 $ 72,370 $1,829 $1,829(c)
Residential Mortgage-Backed Securitizations (a) 42,719 42,719 5,456 5,456(c) $ 90(e)
Tax Credit Investments and Other (b) 5,960 2,101 1,283 1,283(d) 623(e)
Total $121,049 $117,190 $8,568 $8,568 $713
In millions
Aggregate
Assets
Aggregate
Liabilities
PNC
Risk of
Loss
Carrying
Value of
Assets
Carrying
Value of
Liabilities
December 31, 2011
Commercial Mortgage-Backed Securitizations (a) $ 75,961 $ 75,961 $2,079 $2,079(c)
Residential Mortgage-Backed Securitizations (a) 44,315 44,315 4,667 4,667(c) $ 99(e)
Tax Credit Investments and Other (b) 5,395 2,384 837 837(d) 352(e)
Total $125,671 $122,660 $7,583 $7,583 $451
(a) Amounts reflect involvement with securitization SPEs where PNC transferred to and/or services loans for a SPE and we hold securities issued by that SPE. Asset amounts equal
outstanding liability amounts of the SPEs due to limited availability of SPE financial information. We also invest in other mortgage and asset-backed securities issued by third-party
VIEs with which we have no continuing involvement. Further information on these securities is included in Note 8 Investment Securities and values disclosed represent our maximum
exposure to loss for those securities’ holdings.
(b) Aggregate assets and aggregate liabilities are based on limited availability of financial information associated with certain acquired partnerships.
(c) Included in Trading securities, Investment securities, Other intangible assets, and Other assets on our Consolidated Balance Sheet.
(d) Included in Equity investments on our Consolidated Balance Sheet.
(e) Included in Other liabilities on our Consolidated Balance Sheet.
M
ARKET
S
TREET
Market Street Funding LLC (Market Street), owned by an
independent third-party, is a multi-seller asset-backed
commercial paper conduit that primarily purchases assets or
makes loans secured by interests in pools of receivables from
US corporations. Market Street funds the purchases of assets
or loans by issuing commercial paper. Market Street is
supported by pool-specific credit enhancements, liquidity
facilities, and a program-level credit enhancement. Generally,
Market Street mitigates its potential interest rate risk by
entering into agreements with its borrowers that reflect
interest rates based upon its weighted-average commercial
paper cost of funds. During 2011 and 2012, Market Street met
all of its funding needs through the issuance of commercial
paper.
PNC Bank, National Association, (PNC Bank, N.A.) provides
certain administrative services, the program-level credit
enhancement and liquidity facilities to Market Street in
exchange for fees negotiated based on market rates. The
program-level credit enhancement covers net losses in the
amount of 10% of commitments, excluding explicitly rated
AAA/Aaa facilities. Coverage is a cash collateral account
funded by a loan facility. This facility expires in June 2017. At
December 31, 2012, $1.2 billion was outstanding on this
facility.
Although the commercial paper obligations at December 31,
2012 and December 31, 2011 were supported by Market
Street’s assets, PNC Bank, N.A. may be obligated to fund
Market Street under the $11.9 billion of liquidity facilities for
142 The PNC Financial Services Group, Inc. – Form 10-K