PNC Bank 2012 Annual Report Download - page 228
Download and view the complete annual report
Please find page 228 of the 2012 PNC Bank annual report below. You can navigate through the pages in the report by either clicking on the pages listed below, or by using the keyword search tool below to find specific information within the annual report.-
 1
1 -
2
-
3
-
4
-
5
-
6
-
7
-
8
-
9
-
10
-
11
-
12
-
13
-
14
-
15
-
16
-
17
-
18
-
19
-
20
-
21
-
22
-
23
-
24
-
25
-
26
-
27
-
28
-
29
-
30
-
31
-
32
-
33
-
34
-
35
-
36
-
37
-
38
-
39
-
40
-
41
-
42
-
43
-
44
-
45
-
46
-
47
-
48
-
49
-
50
-
51
-
52
-
53
-
54
-
55
-
56
-
57
-
58
-
59
-
60
-
61
-
62
-
63
-
64
-
65
-
66
-
67
-
68
-
69
-
70
-
71
-
72
-
73
-
74
-
75
-
76
-
77
-
78
-
79
-
80
-
81
-
82
-
83
-
84
-
85
-
86
-
87
-
88
-
89
-
90
-
91
-
92
-
93
-
94
-
95
-
96
-
97
-
98
-
99
-
100
-
101
-
102
-
103
-
104
-
105
-
106
-
107
-
108
-
109
-
110
-
111
-
112
-
113
-
114
-
115
-
116
-
117
-
118
-
119
-
120
-
121
-
122
-
123
-
124
-
125
-
126
-
127
-
128
-
129
-
130
-
131
-
132
-
133
-
134
-
135
-
136
-
137
-
138
-
139
-
140
-
141
-
142
-
143
-
144
-
145
-
146
-
147
-
148
-
149
-
150
-
151
-
152
-
153
-
154
-
155
-
156
-
157
-
158
-
159
-
160
-
161
-
162
-
163
-
164
-
165
-
166
-
167
-
168
-
169
-
170
-
171
-
172
-
173
-
174
-
175
-
176
-
177
-
178
-
179
-
180
-
181
-
182
-
183
-
184
-
185
-
186
-
187
-
188
-
189
-
190
-
191
-
192
-
193
-
194
-
195
-
196
-
197
-
198
-
199
-
200
-
201
-
202
-
203
-
204
-
205
-
206
-
207
-
208
-
209
-
210
-
211
-
212
-
213
-
214
-
215
-
216
-
217
-
 218
218 -
 219
219 -
 220
220 -
 221
221 -
 222
222 -
 223
223 -
 224
224 -
 225
225 -
 226
226 -
 227
227 -
 228
228 -
 229
229 -
 230
230 -
 231
231 -
 232
232 -
 233
233 -
 234
234 -
 235
235 -
 236
236 -
 237
237 -
 238
238 -
239
-
240
-
241
-
242
-
243
-
244
-
245
-
246
-
247
-
248
-
249
-
250
-
251
-
252
-
253
-
254
-
255
-
256
-
257
-
258
-
259
-
260
-
261
-
262
-
263
-
264
-
265
-
266
-
267
-
268
-
269
-
270
-
271
-
272
-
273
-
274
-
275
-
276
-
277
-
278
-
279
-
280
 |
 |

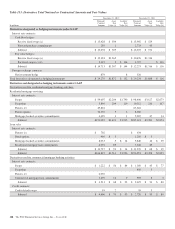
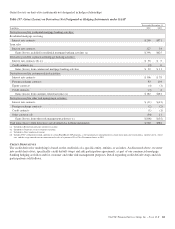
December 31, 2012 December 31, 2011
In millions
Notional/
Contract
Amount
Asset
Fair
Value (a)
Liability
Fair
Value (b)
Notional/
Contract
Amount
Asset
Fair
Value (a)
Liability
Fair
Value (b)
Derivatives used for customer-related activities:
Interest rate contracts:
Swaps $127,567 $3,869 $3,917 $122,088 $3,649 $3,863
Caps/floors – Sold 4,588 1 5,861 6
Caps/floors – Purchased 4,187 21 5,601 19
Swaptions 2,285 82 35 1,713 136 73
Futures (e) 9,113 6,982
Mortgage-backed securities commitments 1,736 2 2 487 1
Subtotal $149,476 $3,974 $3,955 $142,732 $3,804 $3,943
Foreign exchange contracts 10,737 126 112 11,920 231 222
Equity contracts 105 1 3 184 5 8
Credit contracts:
Risk participation agreements 3,530 5 6 3,259 6 5
Subtotal $163,848 $4,106 $4,076 $158,095 $4,046 $4,178
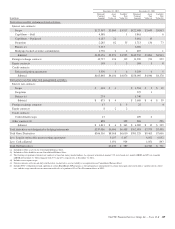
Derivatives used for other risk management activities:
Interest rate contracts:
Swaps $ 601 $ 4 $ 1,704 $ 5 $ 39
Swaptions 225 1
Futures (e) 274 1,740
Subtotal $ 875 $ 4 $ 3,669 $ 6 $ 39
Foreign exchange contracts 17 $ 3 25 4
Equity contracts 8 2 2
Credit contracts:
Credit default swaps 15 209 6
Other contracts (f) 898 358 386 296
Subtotal $ 1,813 $ 6 $ 363 $ 4,289 $ 12 $ 339
Total derivatives not designated as hedging instruments $337,086 $6,696 $6,458 $362,095 $7,575 $7,490
Total Gross Derivatives $366,356 $8,568 $6,610 $391,329 $9,463 $7,606
Less: Legally enforceable master netting agreements 5,107 5,107 6,052 6,052
Less: Cash collateral 1,031 914 1,051 843
Total Net Derivatives $2,430 $ 589 $2,360 $ 711
(a) Included in Other assets on our Consolidated Balance Sheet.
(b) Included in Other liabilities on our Consolidated Balance Sheet.
(c) The floating rate portion of interest rate contracts is based on money-market indices. As a percent of notional amount, 51% were based on 1-month LIBOR and 49% on 3-month
LIBOR at December 31, 2012 compared with 57% and 43%, respectively, at December 31, 2011.
(d) Includes zero-coupon swaps.
(e) Futures contracts settle in cash daily and therefore, no derivative asset or liability is recognized on our Consolidated Balance Sheet.
(f) Includes PNC’s obligation to fund a portion of certain BlackRock LTIP programs, a forward purchase commitment for certain loans upon conversion from a variable rate to a fixed
rate, and the swaps entered into in connection with sales of a portion of Visa Class B common shares in 2012.
The PNC Financial Services Group, Inc. – Form 10-K 209